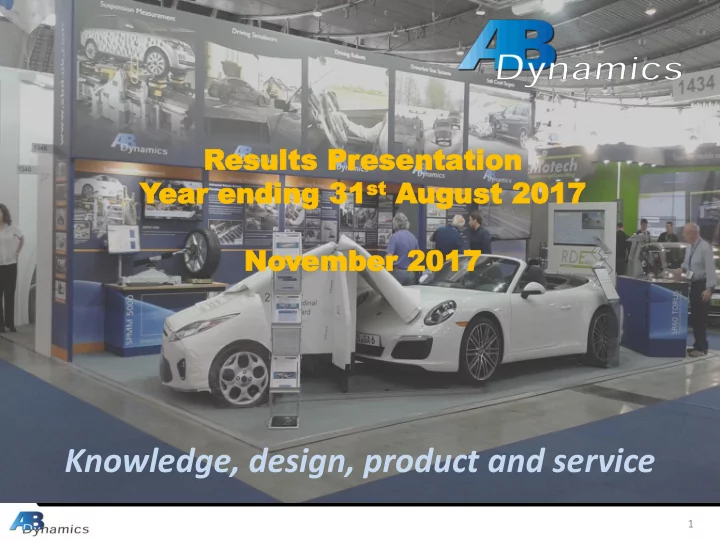

Res esult ults s Pr Pres esen enta tatio tion st Aug Yea ear r en ending ding 31 31 st ugus ust t 20 2017 17 No Novemb ember er 20 2017 17 Knowledge, design, product and service 1
The Business AB Dynamics designs, manufactures and supplies advanced testing and measurement products to the global automotive industry for vehicle suspension, brakes and steering systems ▪ Founded in 1982 in Bradford on Avon ▪ Listed on AIM in May 2013 ▪ Track record of significant profit growth ▪ Over 95% of sales non UK ▪ Strong focus on producing high end/high quality products ▪ Customers include R&D divisions of world leading automotive companies. 2
What we do AB Dynamics products are used by our customers in the following development areas: • Improved Vehicle Dynamics • Brakes, Steering and Suspension • Advanced Safety Systems • Computer Vehicle Models • Driverless Car Technology 3
What we really do. AB Dynamics value is our effective and rapid deployment of IP • We are a solutions provider to the Motor Industry • At £250,000 t/o per head, we are an IP and know-how company • We help our customers design and make vehicles that are safer and more pleasing to drive 4
Our capabilities …. In house design and final assembly Mechanical Electronics/Electrical Software Novel Final Product 5
2017 Highlights Financial Highlights Revenues increased 20.0% to £24.6 million (2016: £20.5 million) Adjusted operating Profit increased 26.2% to £5.9 million (2016: £4.7 million) Adjusted fully diluted EPS increased by 22.5% to 28.28p (2016: 23.09p) Final dividend of 2.00p per ordinary share, 3.331p for the year up 10% (2016: 3.025p) Strong balance sheet with net cash of £9.6m (2016: £10.4m) Operational Highlights Completed the move into new £8.4m state of the art factory and offices Demand for Driving Robots and Guided Soft Targets at an all-time high ADAS market continues to show strong growth as OEMs develop vehicle capabilities Conducting demonstrations of new aVDS as project moves towards commercial production Record order book providing visibility into Q3 FY2018 Oversubscribed equity fundraising in December 2016, to support development of new products and services, new facilities and enhanced routes to market 6
Growth Drivers • Market drivers: – Global spending on automotive R&D continues to grow especially in Asia and N America. – Introduction of ADAS and Autonomous Vehicle Technology demanding new testing technology – Greater dependency on computer aided design, virtual testing and simulation by customers for new vehicle development • Investment: – The company has invested in and continues to expand its manufacturing and R&D facilities – Responding to customer support needs by establishing regional technical and sales support hubs – We continue to recruit of high calibre personnel for R&D, sales support and manufacturing roles – Building internal and external capacity to accelerate new product development – Corporate management to drive business development and technology acquisition • Technology: – CTO role and dedicated business teams in place to drive new business and product development program – Growing software capability to respond to customers move to virtual product development – New driverless test track applications – New advanced Simulators and laboratory testing technology 7
Automotive R&D 8
Synergies 9
New Building 10
Financial Highlights 11
Revenue £m … .increased 20.0% to £24.57m 12
Analysis of Revenue ….by Geographical Area 2017 2016 13
Analysis of Revenue ….by Product Area 2017 2016 14
Operating Profit (Adjusted) £m …..increased by 26.2% 15
Operating Profit Margin (Adjusted) % ….increased to 23.9% 16
Total Assets £m ….. increased by 67% 17
Employees 18
EPS and Dividend Proposed final dividend per share 2.00p Up 10% Earnings per share (pence) 2017 2016 Basic 20.83 22.25 Diluted 20.56 22.25 19
Summary and Outlook • Strong financial and operating performance – Revenue up 20% to £24.57m (2016: £20.47m) – Adjusted operating profit up 26.2% to £5.87m (2016: £4.65m) – Adjusted fully diluted EPS increased by 22.5% to 28.28p (2016: 23.09p) • Markets remain active across all geographies and sectors • Business diversification continued • Commencement of new R&D programmes • Positive current trading – a good platform for future growth 20
Appendices Appendices 21
Consolidated statement of comprehensive income 22
Consolidated statement of financial position 23
Consolidated statement of cash flow 24
Share Information Ordinary shares Shareholding No. % Anthony Best 4,747,107 24.7 Naemi Best 1,500,000 7.8 Anne Middleton 1,400,000 7.3 Liontrust Investment Management 1,149,628 6.0 Schroder Investment Management 975,690 5.0 Castlefield CFP SDL UK Buffetology Fund General 4.4 839,500 Cannacord Genuity Group Inc 4.3 823,683 Hargreaves Landsdown Asset Management 4.2 796,718 Rathbone Investment Management 3.6 683,141 Amati Global Investors 3.4 653,460 25
26
Historic Turnover 27
Recommend
More recommend