
SLIDE 1
Klamath Basin Integrated Fisheries Restoration and Monitoring Plan (IFRMP) Phase 2
Real-time Survey Webinar
August 30th 2018
Mouth of the Klamath River, by Linda Tanner (2011), licenced under CC by 2.0.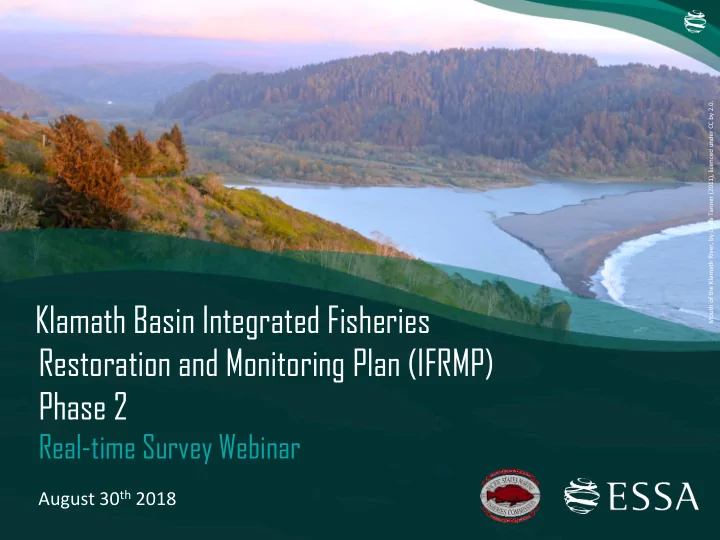
Klamath Basin Integrated Fisheries Restoration and Monitoring Plan - - PowerPoint PPT Presentation
Mouth of the Klamath River, by Linda Tanner (2011), licenced under CC by 2.0. Klamath Basin Integrated Fisheries Restoration and Monitoring Plan (IFRMP) Phase 2 Real-time Survey Webinar August 30 th 2018 WebinarObjectives Reminder of what
Klamath Basin Integrated Fisheries Restoration and Monitoring Plan (IFRMP) Phase 2
Real-time Survey Webinar
August 30th 2018
Mouth of the Klamath River, by Linda Tanner (2011), licenced under CC by 2.0. 2
Computer
presentation slides, questions
Landline
presentation with best call quality & reliability
Smartphone
interactive questions on Mentimeter
Guide all of you through a real-time Mentimeter survey to:
– Rank and weight specific Plan elements,
criteria, questions, etc.
– Influence our direction – Identify ‘problem areas’ needing more
input & people who can help This isn’t the last chance. We will use your input to guide completion of the Initial Rough Draft IFRMP that will be turned over for review October 2018
3
group, trying something new!
“park” or “peak” things to be take offline
– Submit topics we should follow-up with
you on to GoTo chat (to Laurelle)
text messages, etc. Be present, stay in the moment!
4
Having previously reviewed the Jul 2018 workshop summary document delivered Aug 14 & the Aug 24 version of the IFRMP in progress chapters & outline…
1. Brief high-level context presentations (1-3 slides per survey question) 2. Specific real-time survey questions
–
Warm-up example!
5
1. Follow-up with any individuals who had difficulties submitting input 2. Review Initial Rough Draft IFRMP document Oct 2018
6
Warm-up Question
May need to refresh sometimes..
Goals & Objectives Hierarchy
with substantial agreement on top choices
Vision
Goals Objectives Core Performance Indicators Suitability Thresholds
Considered Complete Where We’ve Been Substantial Progress More Input Needed Where We’re Going
9
DIAGNOSTIC INDICATORS Candidate Performance Indicators
VITAL SIGNS Core Performance Indicators (CPIs)
regularly, even when resources are limited, to reliably track overall system status.
What is a “Core” Performance Indicator?
Goal 1 Core Performance Indicators
Table 1 in July 2018 Workshop Summary Document Table 5 and Table 7 in Early release copy of in progress chapters and revised annotated outline.
Goal 1: Naturally self-sustaining native fish populations with healthy demographic traits capable of providing harvestable surplus
(have suitability thresholds for salmon and steelhead only) (have suitability thresholds for Coho, Bull Trout, Redband Trout only) (have no information on suitability thresholds) (can compare to historical extent)
How satisfied are you with the set of core performance indicators for Goal 1 (achieving self-sustaining populations of focal fish species)? What essential CPIs are missing?
Goal 3 Core Performance Indicators
Table 1 in July 2018 Workshop Summary Document Table 5 and Table 7 in Early release copy of in progress chapters and revised annotated outline.
Goal 3: Reduce biotic interactions (ecological, genetic) that could have negative effects on native fish populations.
(have suitability thresholds for coho only) (suggested thresholds exist) (have suitability thresholds for coho only) (no information on suitability thresholds)
How satisfied are you with the set of core performance indicators for Goal 3 (reducing negative biotic interactions)? What essential CPIs are missing?
Goal 4 Core Performance Indicators
Table 1 in July 2018 Workshop Summary Document Table 5 and Table 7 in Early release copy of in progress chapters and revised annotated outline.
Goal 4: Improve freshwater habitat access and suitability/quality for all life stages of focal fish species
(suggested thresholds exist in TMDLs and for most specific species) (suggested thresholds exist for specific variables (water velocity, depth, substrate), but more work needed to determine how habitat suitability is defined and measured) [Will be working further with team
How satisfied are you with the set of core performance indicators for Goal 4 (improving freshwater habitat)? What essential CPIs are missing?
Goal 5 Core Performance Indicators
Table 1 in July 2018 Workshop Summary Document Table 5 and Table 7 in Early release copy of in progress chapters and revised annotated outline.
Goal 5: Create and maintain spatially connected and diverse channel and floodplain morphologies
(suggested thresholds specifically for Klamath via USFWS) (vs. historical extent in USFWS Wetland Data Mapper, but need to set limits) (suggested thresholds exist in literature)
How satisfied are you with the set of core performance indicators for Goal 5 (spatially connected and diverse channel and floodplain morphologies)? What essential CPIs are missing?
Goal 6 Core Performance Indicators
Table 1 in July 2018 Workshop Summary Document Table 5 and Table 7 in Early release copy of in progress chapters and revised annotated outline.
Goal 6: Improving water quality, quantity, and ecological flow regimes
(no information on suitability thresholds)
How satisfied are you with the set of core performance indicators for Goal 6 (water quality, quantity, and ecological flows)? What essential CPIs are missing?
Suitability Thresholds
Good progress, More input needed during document review period
Suitability Thresholds – Focus on Gaps
(vs. historical extent in USFWS Wetland Data Mapper, but need to set limits)
Please keep these gaps in mind when providing written feedback on DRAFT PLAN.
IFRMP Restoration Phasing - Pivot
primarily by suitability thresholds/triggers for POPULATION level performance indicators.
Elwha: Peters et al. 2014.
IFRMP Restoration Phasing
define phasing by TIERS OF WATERSHED PROCESSES
suggest transition between restoration emphasis amongst tiers
Fish P Populations
Survival, growth, reproduction, diversity, distribution
Biological I Interactions
Predation, competition, non-native species, disease mortality
Habitat at
Instream habitat, water quality, food webs, fish passage, physical mortality
Fluvial G Geomo morphic P Processes
Channel and floodplain dynamics, interconnectivity, sediment transport & recruitment
Wate tershed I Inputs ts
Environmental flows, external sediment, nutrient, and pollutant inputs
1 2 3 4 5
Processes in lower tiers support all tiers above them.
habitat
concentrations
Adapted from – EPA 2012, Function Based Framework for Stream Restoration
IFRMP Restoration Phasing
rearing and release of juvenile sucker) until underlying causes can be addressed. Start Restoration Here
Fish P Populations
Survival, growth, reproduction, diversity, distribution
Biological I Interactions
Predation, competition, non-native species, disease mortality
Habitat at
Instream habitat, water quality, food webs, fish passage, physical mortality
Fluvial G Geomo morphic P Processes
Channel and floodplain dynamics, interconnectivity, sediment transport & recruitment
Wate tershed I Inputs ts
Environmental flows, external sediment, nutrient, and pollutant inputs
1 2 3 4 5
Processes in lower tiers support all tiers above them.
CPI Status Phasing Decision Rule
Shift from Restoration to Protection
Indicate the extent you agree or disagree with the components of this proposed approach to phasing restoration.
restoration actions with broadest benefit across most objectives, species, and key stressors
Actions – Where We’re Going
Given all we know… which restoration projects will provide the broadest possible benefits towards full basin recovery?
Restoration Project Selection Workflow
Integrated Tracking Inventory
Objectives Actions Stressors Species
Subregional Action Type Rankings
By coverage of Objectives, Species, Key Stressors Ranks provide ‘breadth of benefit’ weightings to be used in prioritization framework. Prioritization favors projects with broadest benefits as determined above.
Recommended Projects
For further deliberation.
COARSE Filter for Broad Action Types FINE Filter for Specific Projects
Prioritization Framework
Iterative prioritization by criteria of scientific benefit, feasibility, cost.
Document Review Workshops Online Surveys Conceptual Models
Use learning to update understanding (PE). Use learning to adjust scoring for technical merit(PE) and spatial need (ST).
Monitoring
Status & Trends (ST) Project Effectiveness (PE)
Packages of Actions
IMPLEMENT
IMPLEMENT
!
X
Restoration Project Selection Workflow
Integrated Tracking Inventory
Objectives Actions Stressors Species
Subregional Action Type Rankings
By coverage of Objectives, Species, Key Stressors Ranks provide ‘breadth of benefit’ weightings to be used in prioritization framework. Prioritization favors projects with broadest benefits as determined above.
Recommended Projects
For further deliberation.
COARSE Filter for Broad Action Types FINE Filter for Specific Projects
Prioritization Framework
Iterative prioritization by criteria of scientific benefit, feasibility, cost.
Document Review Workshops Online Surveys Conceptual Models
Use learning to update understanding (PE). Use learning to adjust scoring for technical merit(PE) and spatial need (ST).
Monitoring
Status & Trends (ST) Project Effectiveness (PE)
Packages of Actions
Actions – Focusing In & Adding Context
highest level by counts.
Actions – Reporting
What is the preferred method of ordering restoration actions in this list? i.e., by…
addressed
equally important
FURTHER on actions with the broadest benefit for an efficient whole-basin recovery plan.
actions meeting these criteria:
–
>1 objective addressed,
–
>1 species addressed, AND
–
>1 key stressor addressed
(e.g., “narrow” emergency measures to prevent extinction). Address via executive decisions based on this as a starting point.
Actions – Reporting
30
Status and Trend Action Effectiveness New Existing New Existing Monitoring Framework (Phase 3)
31
During the workshop there was unanimous agreement that the IFRMP needs to focus
likewise monitoring questions.
VITAL SIGNS
Easier to prioritize and communicate results at this level.
32
1. Are abundances of focal fish species increasing within and across Klamath subregions to levels adequate to enable persistence, recovery and harvestable surplus? 2. Is juvenile production and survival of focal fish species increasing within and across Klamath subregions to enable persistence, recovery and harvestable surplus? 3. Is the spatial distribution of focal fish species increasing towards their target (historical) extent? 4. Is there a decrease in pathogen prevalence and associated disease-related mortality in salmonids in the lower Klamath River? 5. Is the physical suitability and capacity of habitats for focal fish spawning and rearing improving across the basin? 6. Has there been an increase in channel and floodplain connectivity in the mainstem Klamath River? 7. Are instream ecological flow regimes improving for the Klamath River mainstem and tributary streams, so that these water bodies can better support the focal fish species? 8. Have anthropogenic inputs of nutrients and pollutants been reduced across the Basin (especially in UKL)?
33
Indicate the extent you agree or disagree with the following proposed key IFRMP monitoring questions.
1. Are life history and genetic diversity of focal fish populations being maintained
2. Have control and removal methods been effective in reducing the impacts of exotic/invasive species on focal fish species? 3. Is water quality (e.g., high temperatures, DO, pH, hypereutrophication, etc.) improving across the Basin, especially in UKL? 4. Are aquatic invertebrate communities sufficient to maintain fish populations across the basin? 5. Has there been a reduction in fish mortality from entrainment, scour, and stranding? 6. Are fine & coarse sediment recruitment and transport processes in the Klamath mainstem below the dams moving towards natural patterns? 7. Are anthropogenic inputs of fine sediment into streams decreasing across the Basin? 8. Have there been increases in the extent and diversity of riparian vegetation and wetland areas across the basin (especially in UKL)?
34
Indicate the extent you agree or disagree with the following proposed key IFRMP monitoring questions.
application of monitoring framework.
scenarios, to surface challenges to be addressed in Phase 3 of the IFRMP.
who can contribute to each case study [email dpickard@essa.com if interested]
– Complexities of addressing multiple species
– Case with well established thresholds
– Case primarily using remote sensed information
36
Status and Trend Action Effectiveness
– Case with significant gaps in current or proposed monitoring
– Case which demonstrates how IFRMP can integrate with
existing/ongoing efforts (i.e., ODFW plan) Indicate the extent you agree or disagree with the proposed monitoring case studies.
38
PRIORITIZATION (def.) A prioritization framework provides a systematic, repeatable and transparent rationale for making restoration action decisions given limited funding, capacity and time (Beechie et al. 2008, Roni et al. 2013).
Restoration Project Selection - Prioritization
Integrated Tracking Inventory
Objectives Actions Stressors Species
Document Review Workshops Online Surveys
Subregional Action Type Rankings
By coverage of Objectives, Species, Key Stressors
FINE Filter for Specific Projects
Prioritization Framework
Iterative prioritization by criteria of scientific benefit, feasibility, cost.
Recommended Projects
Ranks provide ‘breadth of benefit’ weightings to be used in prioritization framework. Prioritization favors projects with broadest benefits as determined above. For further deliberation.
COARSE Filter for Broad Action Types
Conceptual Models
Monitoring
Use learning to update understanding (PE). Use learning to adjust scoring for technical merit(PE) and spatial need (ST).
Status & Trends (ST) Project Effectiveness (PE)
projects under consideration
mapping of existing projects will assist in characterizing level of effort/gaps (part of prioritization)
Packages of Actions
Biophysical Process Tier (WI, FG, H, BI) Contribution to Climate Change Resilience Number of Key Limiting Factors Improved for Focal Species Magnitude and Duration of Anticipated Benefits Expected Level of Benefit Action directly avoids impending extirpation
Higher ranking broader spatia prioritize remo furthest down
Benefits to High Value Sites
Higher ranking benefit one or potential population
Spatial Scale of Anticipated Benefits
(Basin-wide, subregion, subbasin, reach)
How would you rate the importance of following criteria on technical merit / scientific benefit?
when applying the prioritization framework.
Number of focal species Goals & Objectives Addressed
Ongoing Annual Costs
(for site maintenance & essential monitoring)
Legal/Administrative Permitting Effort Required Ability to monitor / demonstrate effectiveness Costs Sharing Opportunities Risk of failure?
**Note: Based on July 2018 workshop participant feedback we dropped the initial planning and implementation cost criteria.
how criteria should be weighted when applying the prioritization framework.
How would you rate the importance of following criteria on feasibility and cost?
Level of Landowner Cooperation Required vs. Established (L, M, H) Economic Benefit of the Restoration Action (L, M, H) Stewardship Commitment over Long-term
how criteria should be weighted when applying the prioritization framework.
How would you rate the importance of following criteria on social considerations?
44
How strongly overall do you feel we are getting things right and are on the right track? If you could change/improve just ONE thing about the Initial Rough Draft IFRMP, what would t be?
45
–
1:1 phone conversations to clarify desired input/timeframe
– Provide any additional comments / questions by email to
lsantana@essa.com on survey and/or workshop summary
– Comment period [Oct]
46
GoTo chat to Laurelle Santana or email: lsantana@essa.com
Watershed Input & Fluvial Geo. Objectives & CPIs Defining & Measuring Habitat Suitability Monitoring case studies Applying Scoring Frameworks for Prioritization
NOAA
NOAA
Anderson, USGS
Hoopa Tribe
McBain & Associates
USFWS
Goodman, USFWS
Williams, NOAA
Hoopa Tribe
Partners for Fish and Wildlife Program
Visit the IFRMP website at: http://kbifrm.psmfc.org/ Where you can also read our Plan Vision Brochure AND Synthesis Report:
Synthesis Report. 416 pp + Appendices.
Further Information Contacts
Chris Wheaton (cwheaton@psmfc.org) – lead PSMFC Clint Alexander (calexander@essa.com) – lead ESSA Laurelle Santana (lsantana@essa.com) – communication coordinator, mailing lists, etc.
47
Mouth of the Klamath River by Linda Tanner, 2011, licensed under CC by 2.0
Restoration Project Selection Workflow
Integrated Tracking Inventory
Objectives Actions Stressors Species
Document Review Workshops Online Surveys
Subregional Action Type Rankings
By coverage of Objectives, Species, Key Stressors
FINE Filter for Specific Projects
Prioritization Framework
Iterative prioritization by criteria of scientific benefit, feasibility, cost.
Recommended Projects
Ranks provide ‘breadth of benefit’ weightings to be used in prioritization framework. Prioritization favors projects with broadest benefits as determined above. For further deliberation.
COARSE Filter for Broad Action Types
Conceptual Models
Monitoring
Use learning to update understanding (PE). Use learning to adjust scoring for technical merit(PE) and spatial need (ST).
Status & Trends (ST) Project Effectiveness (PE)
Packages of Actions