
SLIDE 1
Killer Bunny Rabbit Detector
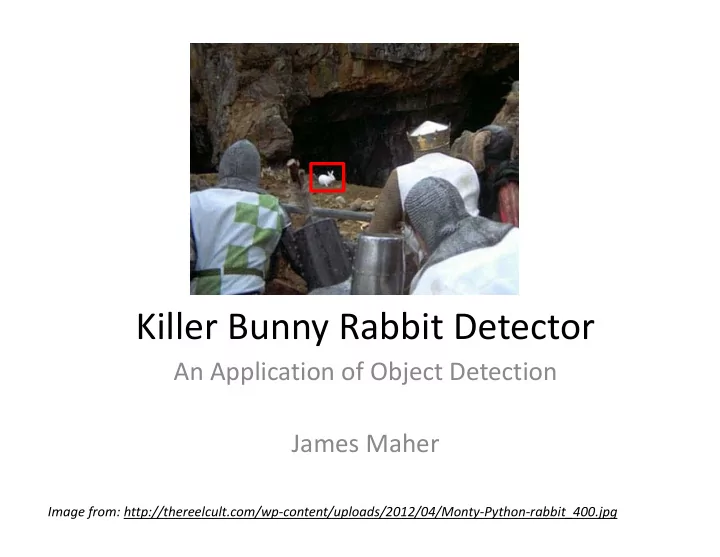
An Application of Object Detection James Maher
Image from: http://thereelcult.com/wp‐content/uploads/2012/04/Monty‐Python‐rabbit_400.jpg
Killer Bunny Rabbit Detector An Application of Object Detection James - - PowerPoint PPT Presentation
Killer Bunny Rabbit Detector An Application of Object Detection James Maher Image from: http://thereelcult.com/wp content/uploads/2012/04/Monty Python rabbit_400.jpg Outline Introduction Previous Work Methodology Results
Image from: http://thereelcult.com/wp‐content/uploads/2012/04/Monty‐Python‐rabbit_400.jpg
Images from [1].
Images from [2,5]. Image from [3].
Image from [8]. An early attempt at object detection through deformable parts.
Gradient Direction
1
1 Gradient Masks
Image from [6].
Image from [7].
∈ ∙ Φx, z ∙ , ∙
∙
Image from [6].
∈ ∙ Φx, z
[1] K. Grandis, Militarizing Your Backyard with Python: Computer Vision and the Squirrel Hordes. PyCon USA 2012. [2] R. Cucchiara, C. Grana, M. Piccardi, and A. Prati, “Detecting moving objects, ghosts, and shadows in video streams,” Pattern Anal. Mach. Intell. IEEE Trans., vol. 25, no. 10, pp. 1337–1342, 2003. [3] D. G. Lowe, “Distinctive image features from scale‐invariant keypoints,” Int. J.
[4] N. Dalal and B. Triggs, “Histograms of Oriented Gradients for Human Detection,” presented at the International Conference on Computer Vision & Pattern Recognition, 2005, vol. 1, pp. 886–893. [5] W. Hoff, “Motion‐Based Segmentation,” presented at the EGGN 512: Computer Vision, 2013. [6] P. Felzenszwalb, D. McAllester, and D. Ramanan, “A Discriminatively Trained, Multiscale, Deformable Part Model,” in Computer Vision and Pattern Recognition,
[7] P. Felzenszwalb, R. Girshick, D. McAllester, and D. Ramanan, “Object Detection with Discriminatively Trained Part Based Models,” in IEEE Transactions on Pattern Analysis and Machine Intelligence, 2010, vol. 32.
[8] M. A. Fischler and R. A. Elschlager, “The representation and matching of pictorial structures,” Comput. Ieee Trans., vol. 100, no. 1, pp. 67–92, 1973.