
SLIDE 1
June 201 4 Investor Presentation At-a-Glance 15.8 M Square Feet - - PowerPoint PPT Presentation
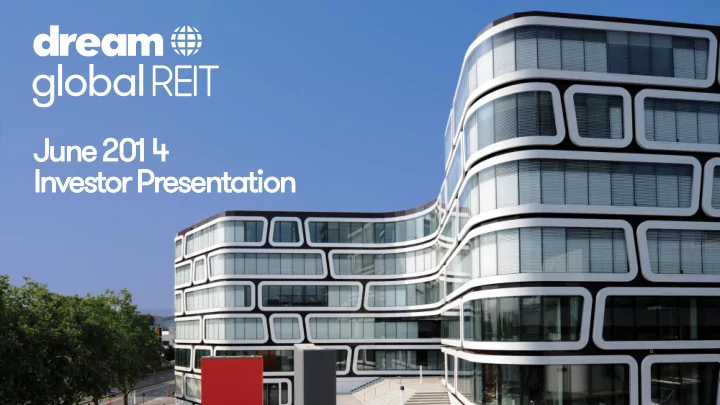
June 201 4 Investor Presentation At-a-Glance 15.8 M Square Feet Hamburg Berlin 293 Properties $2.6 B Cologne Total Assets $1.1 B Frankfurt Market Capitalization 63% of GRI from Stuttgart BIG 7 German Office Markets Munich
2
15.8 M
Square Feet
293
Properties
$2.6 B
Total Assets
$1.1 B
Market Capitalization
63%
“BIG 7” German Office Markets
8.2%
Cash Yield
Cologne Frankfurt Munich Stuttgart Hamburg Berlin
At-a-Glance
Our Objectives
Managing our investments to provide stable, sustainable and gro rowing cash flows through investments in commercial real estate located outside of Canada. To date, 1 00% of our portfolio is located in Germany; Building a diversified, gro rowth-oriented portfolio of commercial properties; Capitalizing on internal growth and seeking accretive acquisition opportunities in our target markets; Growing the value of our assets and maximizing the long-term value of our Units through the active and efficient management of our assets; and Providing predictable d distributions per unit, on a tax-efficient basis.
3
4
Stable Cash Flow from New Properties
Am Sandtorkai, Hamburg Hammer Str. 30-34, Hamburg Löwenkontor, Berlin Karl-Martell-Str, Nuremberg Z-Up, Stuttgart Cäcielienkloster, Cologne Lörracher Str., Freiburg Derendorfer Allee, Düsseldorf Werfthaus, Frankfurt ABC-Str, Hamburg K26, Frankfurt Feldmühleplatz, , Düsseldorf Greifswalder Str, Berlin Oasis III, Stuttgart Moskauerstr, Düsseldorf
Podbielskistr., Hannover Wermer-Eckert- Str., Munich
4
My Falkenried, Hamburg
Strong Support from Dream
Dream’s platform benefits DRG:
Dream has:
power developer, manager and investor
alternative investment transactions
financial institution support 5
Value Creation Germany Acquisitions Germany Finance Accounting Luxembourg Asset Management
Strong & Diverse Management Platform
Leasing Germany
Cengiz Coelhan Head of Finance & Controlling Industry Experience: 8 yrs Anne Braun Head of Asset Management Industry Experience: 12 yrs Michael Schwöbel Head of Leasing Industry Experience: 16 yrs Kim Andersson Investments Industry Experience: 10 yrs Mark Goehring Strategic Assets Projects Industry Experience: 23 yrs
Chief Investment Strategist
Gerwin Holland Chief Investment Strategist Industry Experience: 8 yrs
Portfolio Management
Alexander Sannikov Portfolio Manager Industry Experience: 8 yrs
Acquisitions
Bruce Traversy Head of Investments Industry Experience: 25 yrs Rene Gulliver Chief Financial Officer Industry Experience: 35 yrs Jane Gavan Chief Executive Officer Industry Experience: 26 yrs
Our team is experienced, diversified, on the ground and focused on execution.
6
Investment Summary
Unique opportunity to gain exposure to to the German real estate marke ket, through an established, aligned and experienced Canadian platform. German real estate fundamentals are expected to remain strong and
Successful strategic acquisition of ~C$1 .4 billion of high quality German office assets since our IPO in August 201 1 have led to stable, high quality cash flows:
Critical mass, with approximately C$2.6 billion of assets
Significant improvement in in asset quality and tenant diversification through acquisitions in the “Big 7” office markets in Germany
At Attractive returns – with acquisitions having been completed at a ~400 bps spread between cap rate and cost of financing, equating to 1 0-1 2% levered returns on equity
The establishment of Dream Global as a well-known player in the German property market with institutions, brokers, underwriters and lenders Active asset management through our strong operating platform and local depth of
Superior and well-covered current cash yield of 8.2% German property fundamentals and the lending environment continue to offer attractive spreads on
quality acquisitions.
7
8 0.0 0.5 1 .0 1 .5 2.0 2.5 3.0 Q4 201 1 Q4 201 2 Q4 201 3 Q2 201 4E
Core assets Non-stabilized assets
Growth & Repositioning of our Asset Base
CAD$ billions
Since our IPO, Dream Global has completed $1.4 billion of acquisitions on an accretive basis. Our core assets as a percentage of our portfolio has grown from approximately 72% in 2011 to approximately 93% in asset value in 2014. Core assets also contributed approximately 90% to our gross rental income.
Source: Dream Asset Management
9
Repositioning of our Asset Base
We have sold or have under contract 41 non-core properties at 102% of book value, continuously improving the quality of our portfolio.
Source: Dream Asset Management
CAD$ millions 1 0 20 30 40 50 60 70 201 2 201 3 201 4 (YTD)
Under contract Closed
85% 5% 35% 5% 30%
0% 25% 50% 75% 1 00% IPO Q1 /1 4 Q4/1 4E
1 0
Diversification & Improving Quality of Our Tenants and Cash Flows
Since acquiring our initial portfolio, we’ve diversified the tenant base and improved the quality of
Deutsche Post % of Tenant Base by GRI Contribution of GRI in Big 7 Office Markets
38% 63% 65% 5%
20% 40% 60% 80% IPO Q1 /1 4 Q4/1 4E
Source: Dream Asset Management Source: Dream Asset Management
1 2
Why Germany – Great Fundamentals
Low interest rate environment
Mortgage rates in Germany are among the lowest in recent history, as increased competition in the German lending market has put pressure on credit spreads. The trend is expected to continue
Unemployment at 5.3%, among lowest in EU with employment levels at the highest point in recent years Economy is diversified with GDP outlook improving
The German economy posted a Q1 GDP growth of 2.1%, ahead of the annual forecast of 1.8% for 2014 Domestic demand represent the key driver for growth
Liquid and scalable real estate market
Germany remains one of the most highly sought after real estate investment markets in Europe In Q1/14, the total investment volume for commercial real estate reached €9.9 billion, a y/y increase of 47%
Attractive spreads (~400 bps) between cap rate and borrowing rates for further acquisitions Large office stock with little new construction
Europe overall is in much better shape today and has been continuously improving since Summer 2011
1 3
Declining Unemployment Rate
4 5 6 7 8 9 10 11
Jan-07 Jan-08 Jan-09 Jan-1 0 Jan-1 1 Jan-1 2 Jan-1 3 Jan-1 4
German Unemployment Rate
39,000 39,500 40,000 40,500 41,000 41,500 42,000 42,500
Jan-07 Jan-08 Jan-09 Jan-1 0 Jan-1 1 Jan-1 2 Jan-1 3 Jan-1 4
German Employment Index
% Employment Figures (in 000s)
Source: ILO labour market statistics, Destatis Source: Bloomberg
1 4
German Office Market Property Fundamentals
Declining vacancy Cap rate compression
Top German Office Markets Vacancy Rates Net Yields (CBD) Office Stock (in million sf) Top Canadian Office Markets Office stock (in million sf)
1 Munich
7.0% 4.3% 215
1 Toronto
151
2 Berlin
7.9% 4.6% 182
2
Montreal 70
3 Hamburg
7.5% 4.5% 150
3
Calgary 61
4 Frankfurt
11.4% 4.7% 118
4
Vancouver 43
5 Düsseldorf
11.5% 4.7% 96
5
Ottawa 39
6 Cologne
7.0% 4.7% 75
6
Edmonton 24
7
Stuttgart 5.2% 4.8% 86
7
Halifax 12
Healthy spreads Larger & more liquid
Sources: Jones Lang LaSalle Germany; CBRE Canada
1 5
Attractive Spreads to Bond Yields
1 2 3 4 Apr-05 Apr-06 Apr-07 Apr-08 Apr-09 Apr-10 Apr-11 Apr-12 Apr-13 Apr-14
Spread Comparison: German Prime Yield vs. BBB and 10-yr Bond Yields
Spread (government 1 0 Year bond and avg German prime yield) Spread (BBB corporate EU bond and avg german prime yield)
1 2 3 4 Apr-05 Apr-06 Apr-07 Apr-08 Apr-09 Apr-10 Apr-11 Apr-12 Apr-13 Apr-14
Big 7 Prime Yield to German 10-yr Bond Spread
Current Spread Historical Average Spread
Healthy spreads exist between the German prime yield and Government and corporate bond yields (see top graph). Generally, BBB corporate bonds are a good predictor of the future yields in real estate, as it has a similar risk appetite. Currently, spreads between the prime yields in the Big 7 office markets and the German 10-year government bond yield is ~325 bps, higher than the 10-year historical spread average of ~220 bps (see bottom graph). In this environment, Dream Global is well positioned to continue to acquire assets at attractive spreads.
Sources: Jones Lang LaSalle, Bloomberg, Dream Asset Management Spread (government 1 0-year bond and average German prime yield) Spread (BBB corporate EU Bond and average German prime yield)
Q1 Acquisition Showcase: Very Attractive Spreads on Recent Acquisitions
Purchase Price: C$ 92 million Cap rate: 6.2% Interest rate: 2.33% Debt term: 7-year fixed GLA: 221,241 sf Occupancy: 100% WALT: 4.0 years
My Falkenried, Hamburg
Purchase Price: C$ 22 million Cap rate: 6.5% Interest rate: 1.98% Debt term: 5-year fixed GLA: 64,735 sf Occupancy: 91% WALT: 3.4 years 1 6
Werner-Eckert-Str. 8-12, Munich
1 8
Expanding Our Presence in the “Big 7”
Düsseldorf 1 4% Hamburg 1 5% Frankfurt 1 0% Munich 8% Cologne 6% Stuttgart 5% Berlin 5%
Other 37% C$ millions (IFRS Value)
Gross rental income generated in the Big 7
63% of GRI comes from the Big 7 office markets
50 1 00 1 50 200 250 300 350 400 450 Hamburg Dusseldorf Frankfurt Munich Cologne Stuttgart Berlin
Source: Dream Asset Management
68% of the assets based on IFRS asset values are located in the Big 7 office markets
Top 1 0 Tenants Industry Total Annualized GRI (%) (%) Credit Rating
1 Postal Services / Logistics 35.2 BBB+/Stable 2
3.0 n/a 3 Insurance 2.8 AA-/Stable1 4 Energy/Technical Equipment Services 2.3 n/a 5 Insurance 2.1 A+/Stable 6 Internet 2.0 AA/Stable 7 Financial Services 1 .9 A+/Stable 8 Education 1 .6 AAA/Stable2 9 Entertainment 1 .4 n/a 1 0 Shipping / Oil & Gas 1 .4 BBB+/Stable
1 9
Strong Tenant Relationships, Increased Diversification of Tenant Base
1 . Represents credit rating of Munich RE, parent company of ERGO Insurance Group
20 40 60 80 1 00 IPO 201 1 Q4 201 2 Q4 201 3 Q4 201 4E
Sources: Bloomberg, Dream Asset Management, Standard & Poor’s, Fitch
20
Proactive Leasing Strategy to Maximize Value of Our Assets
79% 80% 81 % 82% 83% 84% 85% 86% 87% 88% 89% 50,000 100,000 150,000 200,000 250,000 300,000 Q3 201 2 Q4 201 2 Q1 201 3 Q2 201 3 Q3 201 3 Q4 201 3 Q1 201 4
New Leases Total Occupancy Leasing Activity Historical Occupancy
(sf) Historical Leasing and Occupancy Data
Our leasing pipeline remains robust. Currently we are working with over 110 prospective tenants for a total of 829k sf of GLA.
Source: Dream Asset Management
21
Manageable Expiries with Mark-to-Market Potential
0% 2% 4% 6% 8% 2014 2015 2016 2017 6.0% 6.8% 4.6% 4.4%
Acquisitions Initial Properties
March 31 , 201 4 Total Portfolio Initial Properties
In-Place Rents (sf/year) € 7.72 € 5.59 Market Rents (sf/year) € 8.85 € 6.18 Mark-to-Market (MTM) - % 1.5% 10.6% Available for Lease (sf) 1,946,000 1,862,000 WALT 4.7 years 4.4 years
1,862,000 sf of space available for lease in our initial portfolio allows for significant potential for uplift when we sign new leases or renew existing leases
Source: Dream Asset Management
Key Performance Indicators
23
Key indicators
Quarter ended March 31 , 201 4 Year ended December 31 , 201 3
OPERATING RESULTS ($‘000, except per unit amounts)
Investment property revenue
$ 67,1 33 $ 220,220
Net rental income
45,800 1 44,853
Basic FFO/unit
0.23 0.85
Basic AFFO/unit
0.21 0.79
Distribution/unit
0.20 0.80
FINANCING Weighted average interest rate
3.35% 3.37%
Interest coverage ratio
3.41 times 3.40 times
Weighted average term to maturity
4.2 years 4.6 years
Level of debt (debt-to-book value, net of cash)
56% 54%
Diversified and Growing Lender Pool
24
Debt Maturity Schedule
100 200 300 400 2014 2015 2016 2017 2018 2019 2020 2021 2022 2023
Mortgage Maturities Convertible Debentures (5.5%; Conv. Price: $13.00)
Debt Maturities (in million Euros)
As at May 31, 2014
In 2016, the term loan credit facility put in place at the time of the IPO comes due. Refinancing discussions with lenders have commenced. The majority of the debt coming due in 2018 relates to the SEB portfolio acquired in 2013. Generally, these properties are well located with high occupancy rates.
25
1 .20 1 .25 1 .30 1 .35 1 .40 1 .45 1 .50 1 .55 Jun-1 1 Dec-1 1 Jul-1 2 Jan-1 3 Aug-1 3 Mar-1 4
26
Favourable Exchange Rate to Our Net Asset Value Through various currency forward contracts, 100% of our distribution payments and convertible debenture interest is hedged for the next 24 months and 50% is hedged for a period of 12 months thereafter. Our balance sheet is not hedged, which has benefitted our unit holders.
Source: Bank of Canada, Dream Asset Management
27
The Current Opportunity
Dream Global REIT is currently generating an 8.2% cash yield. We maintain a strong, active acquisition pipeline and continue to stay disciplined in our approach to enhance scale and diversity within the REIT. We intend to continue our evolution to build towards a high quality office portfolio. Our success in building strong, long-lasting relationships with our German lenders allows us to continue to achieve highly attractive spreads between cap rates and mortgage rates on new acquisitions. We have materially improved the quality and stability of our cash flows in our portfolio and
Our management team/platform has an exceptional track record of finding and creating
Potential strategic JV opportunities may leverage our expertise to source and manage high quality office properties in Germany.
Value Creation – Darmstadt
29
Value Creation – Darmstadt
Upon Acquisition
Darmstadt was one of the largest buildings in the initial portfolio. Subsequent to the DP termination, we leased a portion of the space and worked quickly to transform the interior and exterior of the building to enhance the appeal of the asset to prospective tenants. In Q1 2014, we leased an additional 72k sf at a term of 10 years and at an average rent that is almost 30% better than former DP rents. The tenant is a large educational institution with strong solvency
at Darmstadt, we expect the value of the asset to have increased by 30 – 40%.
After DP Termination Today
30
Leased
WALT
* economic occupancy
Value Creation – Darmstadt
Entrance - Before Entrance - After
31
Value Creation – Darmstadt
Atrium - Before Atrium - After
32
Value Creation – Darmstadt
Interior – Before (DP Space) Interior – After (Pitney Bowes Space)
33
Value Creation – Darmstadt
Interior - Before Interior - After
34
Value Creation – Bremen
35
Value Creation – Bremen
Upon Acquisition After DP Termination Today
Another example of a large and successful repositioning project is our 170k sf
upgrading both the front entrance and the lobby. These transformations have helped in leasing the space to a wide range of tenants, including 33,000 sf to the City of Bremen. Today, the property is 94% leased with an average term of 9 years – with higher income, longer lease terms and a better tenant mix driving cap rate compression and value appreciation.
36
Value Creation – Bremen
Entrance - Before Entrance - After
37
Value Creation – Bremen
Lobby - Before Lobby - After
38
This slide presentation contains forward looking information within the meaning of applicable securities legislation. Forward looking information is based on a number of assumptions and is subject to a number of risks and uncertainties, many of which are beyond Dream Global REIT's control, that could cause actual results to differ materially from those that are disclosed in or implied by such forward looking information. These risks and uncertainties include, but are not limited to, general and local economic and business conditions; the financial condition of tenants;
lease vacant space. All forward looking information in this presentation speaks as of June 20, 2014. Dream Global REIT does not undertake to update any such forward looking information whether as a result of new information, future events or otherwise. Additional information about these assumptions and risks and uncertainties is disclosed in filings with securities regulators filed on SEDAR (www.sedar.com).
39
Jane Gavan CEO (416) 365-6572 jgavin@dream.ca Rene Gulliver CFO (416) 365-5447 rgulliver@dream.ca Alexander Sannikov Portfolio Manager (416) 365-4106 asannikov@dream.ca Gerwin Holland Chief Investment Strategist +352-2736-8933 gholland@dundeeadvisors.de