
SLIDE 1
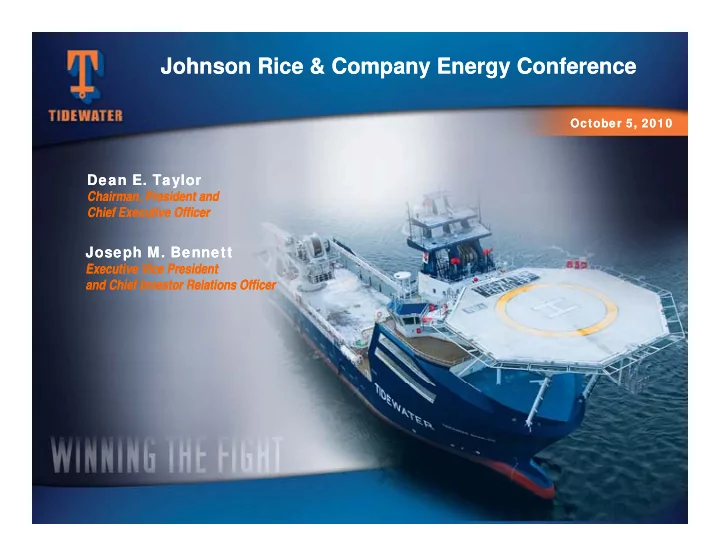
Johnson Rice & Company Energy Conference Johnson Rice & Company Energy Conference
October 5, 2010 October 5, 2010
Johnson Rice & Company Energy Conference Johnson Rice & - - PowerPoint PPT Presentation
Johnson Rice & Company Energy Conference Johnson Rice & Company Energy Conference October 5, 2010 October 5, 2010 Dean E. Taylor Dean E. Taylor Chairman, President and Chairman, President and Chief Executive Officer Chief Executive
October 5, 2010 October 5, 2010
In accordance with the safe harbor provisions of the Private Securities Litigation Reform Act of 1995, the Company notes that certain statements set forth in this presentation provide other than historical information and are forward looking. The actual achievement of any forecasted results, or the unfolding of future economic or business developments in a way anticipated or projected by the Company, involve numerous risks and uncertainties that may cause the Company’s actual performance to be materially different from that stated or implied in the forward-looking statement. Among those risks d t i ti f hi h b d th t l f th C i l d and uncertainties, many of which are beyond the control of the Company, include, without limitation, fluctuations in worldwide energy demand and oil and gas prices; fleet additions by competitors and industry overcapacity; changes in capital spending by customers in the energy industry for offshore exploration, development and production; changing customer demands for vessel specifications, which may make some of our older l t h l i ll b l t f t i t j t i t i k t vessels technologically obsolete for certain customer projects or in certain markets; instability of global financial markets and difficulty accessing credit or capital; acts of terrorism and piracy; significant weather conditions; unsettled political conditions, war, civil unrest and governmental actions, such as expropriation, especially in higher risk countries of operations; foreign currency fluctuations; labor influences proposed by international conventions; and enforcement of laws related to the environment labor and
Phone: 504.568.1010 Fax: 504.566.4580
international conventions; and enforcement of laws related to the environment, labor and foreign corrupt practices. Participants should consider all of these risk factors as well as
2
a 50 566 580 Web: www.tdw.com Email: connect@tdw.com
3
SM SM
4
TIDEWATER DUPONT DOW CHEMICAL EXXON MOBIL
0 75 1.00
TIDEWATER DUPONT DOW CHEMICAL EXXON MOBIL
0.50 0.75 0.25 0.00
2002 2003 2004 2005 2006 2007 2008 2009 Calendar Years
5
Adjusted Return On Avg. Equity 4.3% 7.2% 12.4% 18.5% 18.3% 19.5% 11.9%
** EPS in Fiscal 2004 is exclusive of the $.30 per share after tax impairment charge. EPS in Fiscal 2006 is exclusive of the $.74 per share after tax gain from the sale of six KMAR vessels. EPS in Fiscal 2007 is exclusive of $.37 per share of after tax gains from the sale of 14 offshore tugs. EPS in Fiscal 2010 is exclusive of $.87 per share Venezuelan provision, a $.70 per share tax benefit related to favorable resolution of tax litigation and a $0.22 per share charge for the proposed settlement with the SEC of the company’s FCPA matter.
6
(1)
(1) $2,850m (85%) funded through 6/30/10.
7
35
25 30 Built Acquired Post 6/30/10 15 20
Recent Construction/Acq. Commitments
10 15 5 2001 2002 2003 2004 2005 2006 2007 2008 2009 2010 2011 2012 2013 2001 2002 2003 2004 2005 2006 2007 2008 2009 2010 2011 2012 2013
8 Fiscal Year Fiscal years 2011-2013 include actual deliveries through 6/30/10 and estimated deliveries of vessels committed to build or acquire as of 6/30/10
* Includes eleven new vessels committed to purchase as of 6/30/10
9
3/31/06 3/31/07 3/31/08 12/31/08 12/31/09 12/31/10 12/31/11 12/31/12 12/31/13 Assumptions: 1) Average 45 vessel disposals per year in future (averaged 47 per year last three years). 2) Includes 35 vessels under construction (including eleven purchase commitments) in year delivered plus additional 2) Includes 35 vessels under construction (including eleven purchase commitments) in year delivered plus additional newbuilds/acquisitions from approximately $500 million per year of future commitments (average additional 20 vessels per year). Tidewater is not committed to spending $500 million annually, but this level is used as an assumption in estimating average fleet age in the future.
10
$179M
$95M $55M $72M
$124M
6 AHTS
11 Amounts depict vessel count and total cost in quarter commitment was made to acquire (not when delivery or payments were made)
1 MPSV 1 PSV 4 AHTS 6 AHTS 6 AHTS 3 PSV’s 4 PSV’s 1 AHTS
12
13
14
$700 CAPX Dividend Share Repurchase CFFO $500 $600 $700 $300 $400 $100 $200
$- 2000 2001 2002 2003 2004 2005 2006 2007 2008 2009 2010
15
16
17
(Includes AHTS and PSV’s only) Estimated as of Late (Includes AHTS and PSV’s only) Estimated as of Late-
July 2010
500
300 400
200
100
Tidewater Competitor #2 Competitor #3 Competitor #4 Competitor # 5 Competitor #1 Avg. All Others (1,774 total vessels for 300+ owners)
Source: ODS-Petrodata and Tidewater
18
19
(Includes AHTS and PSV’s only) Estimated as of Late (Includes AHTS and PSV’s only) Estimated as of Late-
July 2010
As of late-July 2010, there are approximately 411 additional AHTS and PSV’s (~16% of the global fleet) under construction.
ls V)
Vessels > 25 years old today
ber of Vesse (AHTS & PSV
Numb Built (
Global fleet estimated at 2,510 vessels, including 323 vessels that are 30+ yrs old (13%), and another 473 vessels that are 25-29 yrs old (19%) Source: ODS-Petrodata and Tidewater
20
This info is not meant to be a prediction of future earnings
performance, but simply an indication of earning sensitivities resulting from future fleet additions and reductions and varying operating assumptions.
(+ 10%)
(+ 10%)
263 vessels assumes (177 current new vessels + 35 under construction + ~ 20 additional new vessels per year for three years).
* 6/30/10 quarter actual stats 21
22
October 5, 2010 October 5, 2010
24
25
(As of 6/30/10) (As of 6/30/10)
(As of 6/30/10) (As of 6/30/10)
(A) Net new vessels added to the fleet since January 2000, including 35 vessels under construction at 6/30/10. This new l t t l l d 18 l th t i d th di d ( tl t TDW j i t t ) vessel total excludes 18 new vessels that were acquired, then disposed (mostly to a TDW joint venture.) (B) Total fleet count excludes 89 stacked vessels as of 6/30/10. (C) 517 vessel dispositions generated $665 million of proceeds and $276 million of gains over the last 11 years.
26
$700
Total Fleet
$500 $600 ions) %) 50% 60%
Operating Margin %
38.6% 46.5% 36.9% 49.1% 54.6% 51.9% 51.3% 46.8%
$300 $400 MARGIN (in mill ING MARGIN (% 40% 30%
New Vessels
37.6% 41.9% 36.9% 38.7%
$200 $300 OPERATING M OPERATI 20% 10% $0 $100 2000 2001 2002 2003 2004 2005 2006 2007 2008 2009 2010
Traditional Vessels
Note: Cash operating margins are defined as vessel revenue less vessel operating expenses
Fiscal Years
27
* Dayrate and utilization information is for all classes of vessels operating international
28
* Dayrate and utilization information is for all classes of vessels operating international
29
* Dayrate and utilization information is for all classes of vessels operating in the U.S.
30
* Dayrate and utilization information is for all classes of vessels operating in the U.S.
31
Source: ODS-Petrodata and Tidewater
32
(Estimated as of Late (Estimated as of Late July 2010) July 2010) (Estimated as of Late (Estimated as of Late-July 2010) July 2010)
76 Top 10 customers Other Operators Top 10 Customers 232 88 Other Operators 92 232
33
Source: ODS‐Petrodata and Tidewater
200% 150% 50% 100% OSX 52% 0% 50% S&P 500 9% DJIA 16% TDW 36%
Mar-05 Mar-06 Mar-07 Mar-08 Mar-09 Mar-10 TDW DJIA S&P500 OSX 34