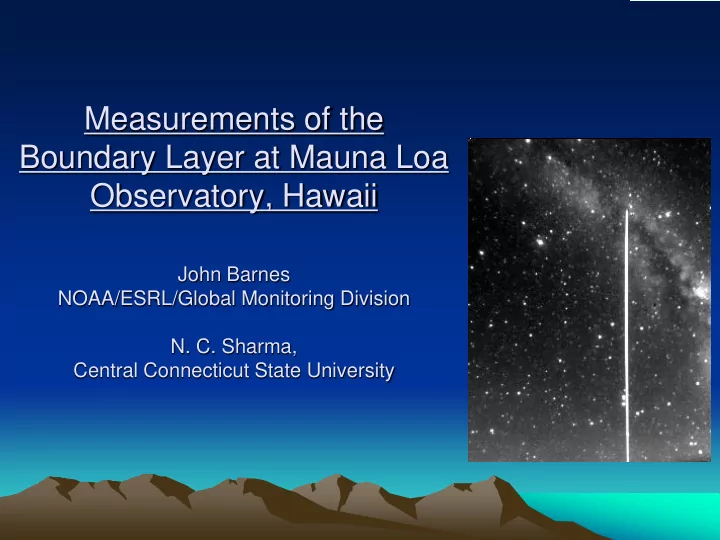

Measurements of the Boundary Layer at Mauna Loa Observatory, Hawaii John Barnes NOAA/ESRL/Global Monitoring Division N. C. Sharma, Central Connecticut State University
We would like to acknowledge: GMD Aerosol group GMD Global Radiation group Early and present Mauna Loa Observatory Staff Earlier work on MLO Boundary Layer: Bernard Mendonca, Characterized Upslope/Downslope with tethered balloon (J. Appl. Meteor. 1969) Steve Ryan, barrier wind effect, source altitudes of MLO air (JGR, 1997)
Medonca, J. Appl. Meteor. 1969 Tethered balloon measurement of morning transition Daytime (Upslope) layer 7 X thicker than Nighttime (Downslope) Ryan, JGR, 1997 Daytime source region below MLO: 90% of time Nighttime source region below MLO: 60% of time
190 m View of MLO Looking West 7 degree slope CLidar 38 m Camera Tower 10 m
Aerosol Measurements Over Mauna Loa Observatory Nimmi C. P. Sharma, John E. Barnes Poster Session ALTITUDE VS. AEROSOL EXTINCTION (2007 & 2008) Grand Average Filtered Aerosol Extinction Mean + sigma Mean - sigma 10000 Tropospheric 9000 Aerosol Scale Height 8000 ALTITUDE (MASL) 2.5 km 7000 6000 5000 4000 0 0.0005 0.001 0.0015 0.002 0.0025 0.003 0.0035 0.004 0.0045 0.005 AEROSOL EXTINCTION (1/KM)
190 m ~30% more Aerosol 38 m Tower 10 m Upslope/Downslope Transition Aerosol Intake Better mixing
190 m Altitudes of peak in downslope (nighttime) aerosols CLidar 38 m Camera Tower 10 m Aerosol Intake
190 m View of MLO Looking West 7 degree slope 38 m Tower
190 m View of MLO Looking West 7 degree slope Daily Delta T (C ) 4 6 8 18 3
190 m Daytime - Heating 100% 6.84 kW*Hr/m 2 1% Albedo Air Heating 5% 56% Ground Heating
Possible future work: Wind profiler Better Lava temperature measurements
John Barnes, NOAA/ESRL/Global Monitoring Division N. C. Sharma, Central Connecticut State University
NASA/CALIOP Space Lidar, Aerosol Phase Functions Vary large range (not known CLidar and Satellite well) to convert single-angle scatter to total scatter. Lidar Ratio Which one is “right”? Ext/Back
Recommend
More recommend