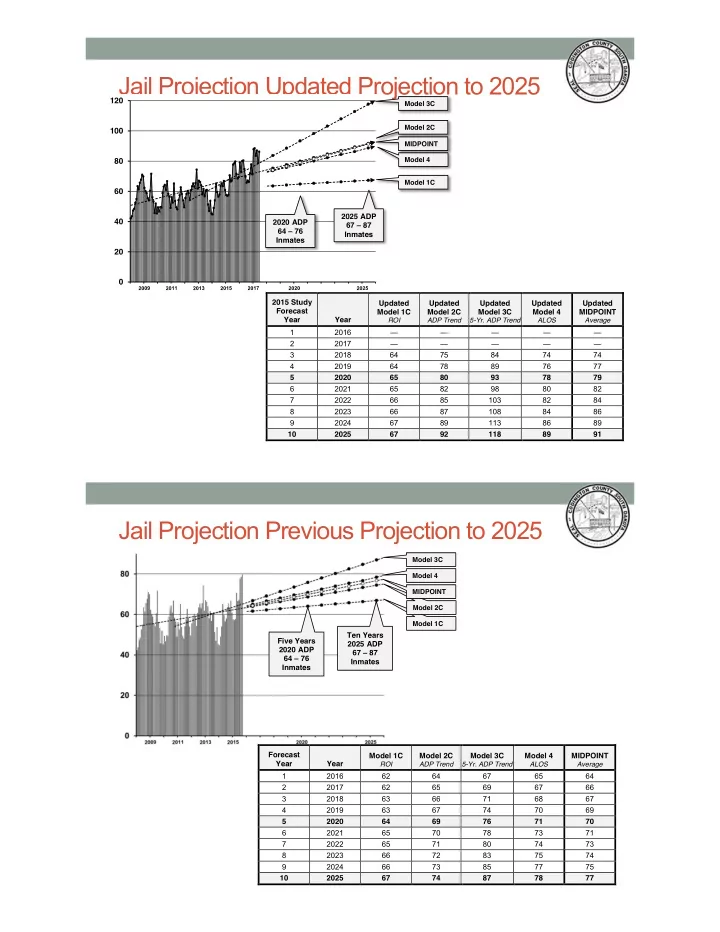

Jail Projection Updated Projection to 2025
— –
— — — — — — — — — — — – ’ — – — – — – ’ 20 40 60 80 100 120 2020 ADP 64 – 76 Inmates 2025 ADP 67 – 87 Inmates
Model 1C Model 4 MIDPOINT Model 2C Model 3C
— –
2015 Study Forecast Year Year Updated Model 1C
ROI
Updated Model 2C
ADP Trend
Updated Model 3C
5-Yr. ADP Trend
Updated Model 4
ALOS
Updated MIDPOINT
Average
1 2016 — — — — — 2 2017 — — — — — 3 2018 64 75 84 74 74 4 2019 64 78 89 76 77 5 2020 65 80 93 78 79 6 2021 65 82 98 80 82 7 2022 66 85 103 82 84 8 2023 66 87 108 84 86 9 2024 67 89 113 86 89 10 2025 67 92 118 89 91 — – ’ — – — – — – ’ – –
Jail Projection Previous Projection to 2025
— at the Codington County Detention Center (2016 – 2025)
— – — – — – — – Five Years 2020 ADP 64 – 76 Inmates Ten Years 2025 ADP 67 – 87 Inmates
Model 1C Model 2C MIDPOINT Model 4 Model 3C
— –
Forecast Year Year Model 1C
ROI
Model 2C
ADP Trend
Model 3C
5-Yr. ADP Trend
Model 4
ALOS
MIDPOINT
Average
1 2016 62 64 67 65 64 2 2017 62 65 69 67 66 3 2018 63 66 71 68 67 4 2019 63 67 74 70 69 5 2020 64 69 76 71 70 6 2021 65 70 78 73 71 7 2022 65 71 80 74 73 8 2023 66 72 83 75 74 9 2024 66 73 85 77 75 10 2025 67 74 87 78 77 — – — – — – — – – –