
SLIDE 1
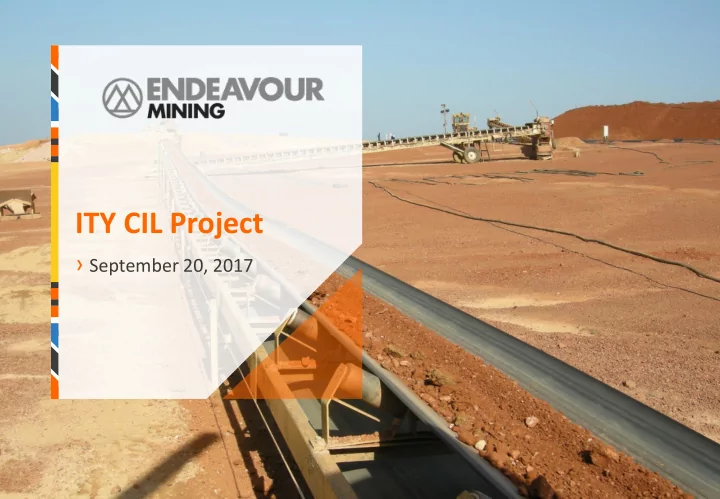
ITY CIL Project
› September 20, 2017
ITY CIL Project September 20, 2017 SPEAKERS TABLE OF CONTENT - - PowerPoint PPT Presentation
ITY CIL Project September 20, 2017 SPEAKERS TABLE OF CONTENT SBASTIEN DE MONTESSUS 1 ITY CIL PROJECT OVERVIEW Chief Executive Officer, President & Director 2 JEREMY LANGFORD ITY CIL PROJECT DETAILS Chief Operating Officer 3
› September 20, 2017
Note : All amonts are in US$
SÉBASTIEN DE MONTESSUS Chief Executive Officer, President & Director JEREMY LANGFORD Chief Operating Officer VINCENT BENOIT EVP – CFO and Corporate Development PATRICK BOUISSET EVP – Exploration and Growth
SPEAKERS TABLE OF CONTENT ITY CIL PROJECT DETAILS
APPENDIX
ITY CIL PROJECT TO BECOME OUR NEXT FLAGSHIP ASSET
3
Construction launched based on robust optimization study results
Long 14-year mine life High production level: ‒ 235kozpa on average
‒ +200kozpa on average
‒ 173kozpa on average
$494/oz on average over
first 5 years
$549/oz on average over
first 10 years
$580/oz on average over
mine life
At $1,250/oz: ‒ After-tax IRR of 40% ‒ After-tax NPV5% of $710m At $1,000/oz: ‒ After-tax IRR of 23% ‒ After-tax NPV5% of $343m On track to meet our 5-
year discovery target of 4-6Moz
‒ 1.5Moz already
added over last 12- months
‒ Many near-mine
targets identified
‒ Maiden resource on
Le Plaque expected by year-end
ROBUST ECONOMICS LOW AISC EXPLORATION UPSIDE STRONG PRODUCTION PROFILE
ITY CIL OPTIMIZATION STUDY
KEY CHANGES INCLUDE:
›
KEY CHANGES INCLUDE:
› Indicated resource inventory
increased by 1.5Moz following exploration success
› Added Bakatouo high-grade deposit
upfront
› Mill size increased from 3Mtpa to
4Mtpa
› Process plant design optimized to
maximize construction and operating synergies with Houndé
› Improved recovery rates › Optimized site layout
SUMMARY OF OPTIMISATION STUDY
4 2017 OPTIMIZATION STUDY 2016 FEASIBILITY STUDY VARIANCE (OS VS. FS)
LIFE OF MINE PRODUCTION
Strip ratio, w:o 1.9 2.1 (10%) Tonnes of ore processed, Mt 57.0Mt 41.0Mt +39% Grade processed, Au g/t 1.57 g/t 1.42 g/t +10% Gold content processed, Moz 2.87 Moz 1.88 Moz +53% LOM Average Gold recovery, % 86% 83% +3% Gold production, Moz 2.47 Moz 1.56 Moz +58% Mine life, years 14.3 years 13.7 years +4% Average annual gold production, koz 173 Koz 114 Koz +52% Cash costs, $/oz $554 $528 +5% AISC, $/oz $580 $603 (4%)
AVERAGE FOR YEARS 1 TO 5:
Gold production, kozpa 235 koz 165 koz +42% Cash costs, $/oz $472/oz $446/oz +6% AISC, $/oz $494/oz $507/oz (3%)
AVERAGE FOR YEARS 1 TO 10:
Gold production, kozpa 204 koz 135 koz +51% Cash costs, $/oz $523/oz $488/oz +7% AISC, $/oz $549/oz $559/oz (2%)
CAPITAL COST
Initial capital cost, $m $412m $307m +34%
$61m $25m +160% Upfront capital cost, $m $351m $282m +24%
ECONOMICS (BASED ON $1,250/OZ)
After-tax IRR 40% 36% +12% After-tax NPV ( 0% discount rate) $990m $607m +63% After-tax NPV ( 5% discount rate) $710m $411m +73% Payback period 1.8 years 2.1 years (17%)
Significant improvement over 2016 Feasibility Study
ITY CIL OPTIMIZATION STUDY
SIGNIFICANT INCREASE IN RESERVES
5
Mill size increase to capture value created from exploration success
OS vs FS reserves
OS vs FS reserves
1.9Moz 0.8Moz 2.9Moz 1.4Moz 4.0Mtpa 3.0Mtpa 2.0Mtpa 1.5Mtpa 2016 FS 2015 PFS 2014 Scoping Study 2017 Optimisation Reserve Mill Size
Mill size and reserves growth
ITY CIL OPTIMIZATION STUDY
LONG-LIFE LOW-COST PROJECT
6
Significantly improved production profile
$643/oz $677/oz $532/oz $567/oz $493/oz $407/oz $612/oz $484/oz Year 8 162koz Year 6 Year 7 Year 5 151koz Year 4 213koz 238koz 224koz Year 2 201koz Year 3 250koz Year 1 159koz Year 9 190koz Year 10 250koz AISC for OS FS production OS production
average production
$602/oz $598/oz
Production Profile
average AISC over first 5 years
Exploration potential ITY CIL OPTIMIZATION STUDY
SIGNIFICANT EXPLORATION UPSIDE
Resource details provide in section “Ity CIL Project Details”
7
On-track to achieve exploration discovery target of 4-6Moz
3.8Moz 2.3Moz 1.5Moz added 2017 M&I Resource
(Base for OS)
5-Year Discovery Target
(published Nov. 2016)
2016 M&I Resource
(Base for FS)
4-6Moz Discovery Target
M&I Resource Evolution
ITY CIL OPTIMIZATION STUDY
ROBUST PROJECT ECONOMICS
8
IRR of +20% even at $1,000/oz
$710m / 40% $343m / 23% $920m / 50% NPV5% / IRR $1,400/oz $1,250/oz $1,000/oz
$1,200m $0m $200m $400m
$600m $800m $1,000m $1,400m
Y12 Y13 Y14 Y15 Y1 Y2 Y3 Y4 Y5 Y6 Y7 Y8 Y9 Y10 Y11
22-MONTH PAYBACK PERIOD 14-YEAR MINE LIFE
Cumulative after-tax free cash flow, US$m
ITY CIL OPTIMIZATION STUDY
2010 2011 2012 2013 2014 2015 2016 2017 2018 2019 2020 2021 2022 Kalana, Mali y (CIL), Côte d'Ivoire
TRANSITIONING OUR IN-HOUSE TEAM FROM HOUNDE TO ITY
First gold pour expected by mid 2019
Houndé Construction 9 Ity CIL Construction
KALANA ITY CIL Houndé
2017 2018 2019 2020 2021 2022
GREENFIELD EXPLORATION
DFS Optimization Construction Resource Definition Studies Construction ITY CIL OPTIMIZATION STUDY
RCF UPSIZED AND EXTENDED
10
Provides significant headroom to fund growth projects
INCREASED PRINCIPAL AMOUNT DECREASED INTEREST RATE LOWER MAINTENANCE COSTS TERM EXTENDED REPAYMENT › Increased from $350m to $500m › Decreased from LIBOR plus 3.75% to 5.75% to LIBOR plus 2.95% to 3.95% on
drawn portion
› Decreased from commitment fees on undrawn portion from 1.31% to 2.01%
(depending on the applicable margin) to 1.03%
› Expected to represent savings of approximately $5 million per year › The term of the new RCF is four years, maturing in September 2021,
representing an extension of the previous RCF which matures in March 2020
› Upsized RCF is repayable as a single bullet payment on the maturity date,
compared to semi-annual reductions/repayments starting September 2018 for the 2015 RCF
› New RCF can be repaid at any time without penalty, and offers Endeavour a
corporate style covenant package, which enhances the flexibility to run its business from day-to-day
ITY CIL OPTIMIZATION STUDY
A stronger and enlarged bank pool
PROJECT IS FULLY FUNDED
11
Significant headroom provided by cash flow from operations
$150m $85m $130m Growth Projects $495m Sources of Funding Ity Equipment Financing La Mancha Placement Nzema Sale RCF Upsize Liquidity Sources (as at June 30, 2017) $215m Hounde remaining capex (as at June 30, 2017) Ity Capex FCF before Growth Capex
(H2-’17 to H1-19)
Undrawn RCF Cash
ITY CIL OPTIMIZATION STUDY
IMPROVING THE QUALITY OF OUR PORTFOLIO
Significant Progress Already Made
12
5 10 15 20 $1,200 $450 $500 $550 $600 $650 $700 $750 $800 $850 $900 $950 $1,000 $1,050 $1,100 $1,150
Mine life, years 5 10 15 20 $850 $650 $450 $1,200 $1,050 Mine life, years
Bubble size represents production AISC, $/oz Ghana Mali Burkina Faso Côte d’Ivoire AISC, $/oz
PORTFOLIO IN 2015 PORTFOLIO IN 2017
Nzema Tabakoto
Agbaou
Youga
Tabakoto
Agbaou Houndé
Kalana Potential
Ity CIL
Ity HL Karma
Assessment expected by mid-2018
ITY CIL OPTIMIZATION STUDY
ON TRACK TO LOWER GROUP’S AISC TO BELOW $800/OZ
13
Developing projects to improve the portfolio quality
$895/oz $922/oz $1,010/oz $1,317/oz
800-900koz 317koz +900koz 2020 2019 2016 2017 2018 800-900koz 584koz 2015 517koz 2014 2013 462koz 2021 +900koz 2022
Ity (CIL), Côte d’Ivoire Kalana, Mali Group AISC Houndé, Burkina Faso Youga, Burkina Faso Ity (Heap Leach), Côte d’Ivoire Agbaou, Côte d’Ivoire Karma, Burkina Faso Nzema, Ghana Tabakoto, Mali
+800koz
Annual production
Mine life
≤800$/oz
All-in Sustaining Cost
STRATEGIC MILESTONES
<$800/oz ITY CIL OPTIMIZATION STUDY
For 2019
SUMMARY OF INDEPENDENT OPTIMISATION STUDY FOR CIL PROJECT
Lead Consultant: Contributions of:
15
KEY CHANGES MADE TO OPTIMIZED STUDY
› CIL process plant increased from 3Mtpa to
4Mtpa.
› Construction of a 26MW full back up power
station
› Addition of a diverter/flop-gate system to
maximize plant utilization
› Improved recoveries based on additional
metallurgical testwork, namely the Daapleau Primary (fresh) material
› Process plant design optimized to maximize
replication of Houndé design
› Optimized upfront capital cost and sequenced
“Self-Perform” methodology.
› Site layout optimized
ITY CIL OPTIMIZATION STUDY
1.5MOZ OF INDICATED RESOURCES ADDED SINCE THE FS
Optimization study was preformed to capture the increased resource inventory
16 2017 OPTIMIZATION STUDY INVENTORY 2016 FEASIBILITY STUDY INVENTORY Deposits
Indicated Resources Inferred Resources Indicated Resources Inferred Resources Tonnage (Mt) Grade (Au g/t) Content (Au koz) Tonnage (Mt) Grade (Au g/t) Content (Au koz) Tonnage (Mt) Grade (Au g/t) Content (Au koz) Tonnage (Mt) Grade (Au g/t) Content (Au koz) Open Pits Daapleu 28.1 1.50 1,349 0.7 0.92 22 19.9 1.51 965 4.3 1.15 160 Mont Ity / Flat 10.1 2.20 716 9.7 1.40 436 7.5 2.19 527 11.1 1.92 684 Gbeitouo 2.9 1.35 124 0.3 1.48 13 2.9 1.35 124 0.3 1.48 13 Walter 1.6 1.23 65 0.6 1.35 26 2.1 1.21 81 0.7 1.32 28 Zia NE 6.7 1.28 274 4.0 1.40 178 7.7 1.31 325 4.0 1.39 179 Bakatouo 10.2 2.14 704 0.6 2.27 44
1.0 2.14 66 0.4 2.11 28
60.6 1.69 3,298 16.3 1.43 747 40.1 1.57 2,022 20.4 1.62 1,064 Existing Stockpiles Aires 5.8 1.09 202 0.2 0.78 6 5.8 1.09 202 0.2 0.78 6 Teckraie 2.8 1.07 97 0.1 0.55 2 2.8 1.07 97 0.1 0.55 2 Verse Ouest 5.9 0.99 187 2.3 0.50 37
0.85 230 Sub-total 14.5 1.04 486 2.6 0.54 45 8.6 1.08 300 8.7 0.85 238 Total 75.1 1.57 3,784 18.9 1.30 792 48.7 1.48 2,322 29.1 1.39 1,302 ITY CIL OPTIMIZATION STUDY
CIL RESERVES INCREASED BY 1.0Moz TO 2.9Moz
17
Deposits
Optimization Study Reserves, as at September 1, 2017 Feasibility Study Reserves, as at October 1, 2016 Variance (koz) Tonnage (Mt) Grade (Au g/t) Content (Au koz) Tonnage (Mt) Grade (Au g/t) Content (Au koz) Open Pits Bakatouo 6.9 2.40 532
Colline Sud
18.4 1.72 1,015 19.3 1.51 936 +79 Mont Ity / Ity Flat 7.4 2.03 479 3.8 2.19 268 +211 Gbeitouo 2.5 1.37 111 2.6 1.35 112 (1) Walter 1.2 1.07 41 1.9 1.22 73 (32) Zia NE 6.2 1.06 210 4.8 1.24 192 +18 Sub-total 42.5 1.75 2,390 32.4 1.52 1,580 +810 Existing Stockpiles Aires 5.8 1.09 202 5.8 1.09 202
8.7 1.02 284 2.8 1.07 97 +187 Sub-total 14.5 1.05 486 8.6 1.08 300 +186 Total 57.0 1.57 2,876 41.0 1.42 1,880 +996
Addition of Bakatouo and increases at Mont Ity, Teckraie, and Daapleu
ITY CIL OPTIMIZATION STUDY
SITE LAYOUT
18 18
ITY CIL OPTIMIZATION STUDY
› Low Life of Mine strip ratio of 1.9 › Optimized mine plan scheduling and
stockpile build-up compared to FS
› Owner operated mining selected
using 90-tonne haul trucks with Komtasu to share maintenance spare parts synergies with Hounde and Karma
› Maximum mining movement of
16Mtpa (decreased from 17Mtpa in the FS to be more conservative)
› Mining is scheduled to commence 3
months before the start of the processing
19
Low strip ratio operation
MINING
5.9Mt 5.4Mt 3.8Mt 4.3Mt 5.1Mt 4.8Mt 4.7Mt 5.9Mt 5.8Mt 4.6Mt 1.9 2.3 2.2 2.1 2.3 2.4 1.7 1.8 2.4 1.3 Year 10 Year 9 Year 8 Year 7 Year 6 Year 5 Year 4 Year 3 Year 2 Year 1 Strip ratio, w:o Total ore mined, Mt
Mining Schedule (Years 1-10)
Mill capacity: 4.0mtpa
ITY CIL OPTIMIZATION STUDY
PROCESSING
20
4.0 Mtpa Conventional Gravity Circuit/Carbon-In-leach Plant
1.3g/t 1.8g/t 1.6g/t 1.4g/t 1.8g/t 2.0g/t 1.9g/t 2.2g/t 2.3g/t 2.3g/t Yea ear 1 86.0% 250koz Yea ear 2 83.7% 250koz Yea ear 10 159koz 93.3% Yea ear 9 190koz 80.1% Yea ear 8 162koz 80.2% Yea ear 7 151koz 85.5% Yea ear 6 201koz 86.7% Yea ear 5 224koz 87.2% Yea ear 4 213koz 88.3% Yea ear 3 238koz 84.0%
Recovery rate, % Recovered gold, koz Grade processed, g/t Au
LOM Mill throughput › Process plant capacity increased from 3 Mtpa (FS) to 4 Mtpa › Integrated synergies between Ity and Hounde plants with similar process layout, identical SAG and Ball Mill designs, Engagement of
the same Engineer and respective Design Management and Project Management Teams (Lycopodium) and Same Owners Management Team
› Key changes from FS include:
‒ 20MW Full Back-Up Power Station added ‒ Primary crusher increased to C160 ‒ SAG/Ball Mills upsized to replicate Hounde with 6MW VVVF on both drives ‒ Pre-leach thickener increased to 38 m diameter ‒ Number of CIL tanks increased from 6 to 8 ‒ Elution circuit increased from 15 to 18 t (Hounde 10t) ‒ Detox and arsenic destruction capacity increased to control significant Cu and As in ore ‒ Reagent mixing/storage capacity increased, and includes 50t/day VPSA oxygen plant
ITY CIL OPTIMIZATION STUDY
METALLURGY
21
Life of mine recovery rate increased from 83% to 86%
Gold Recovery Rate by Deposit INSIGHTS
› The overall life of mine
recovery rate improved due to: ‒ The addition of high- recovery Bakatouo oxide and fresh ore ‒ Additional reserves at the high-recovery Mont Ity/Flat deposit ‒ Better recovery on Daapleu Sulphides following additional testwork, which increased from 60% to 66%
LOM Tonnage, Mt % of LOM Tonnage Gold Grade, g/t Au Recovery Rate, % Bakatouo Oxides/Fresh 6.1 11% 2.28 95/97% Bakatouo Transition 0.8 1% 3.29 84% Daapleu Sulphides 7.8 14% 2.41 66% Daapleu Oxides 10.6 19% 1.21 85% Gbeitouo 2.5 4% 1.37 88% Mont Ity/Flat 7.4 13% 2.03 89% Walter 1.2 2% 1.08 96% Zia NE 6.2 11% 1.06 97% Stockpiles 14.5 25% 1.04 92% Total 57 100% 1.57 86%
ITY CIL OPTIMIZATION STUDY
INSIGHTS
› The initial capital cost has been estimated at $412
million, inclusive of $34 million for contingencies
› The upfront capital is expected to be $351 million
with $61 million of lease financing for the mining fleet and power station
› A full 26MW full high speed diesel back-up power
station provides 100% redundancy.
› Capital costs include the construction of a 58
kilometer, 91kv overhead power line to connect to the national grid at Danane with a substation at Ity which will be owned by Côte d’Ivoire Energie (“CIE”)
› EPCM with Endeavour will self-perform the
development of the mine infrastructure and provision of ongoing drill and blast and mine
team
CAPITAL COST ESTIMATE
22
Optimized CAPEX and sequenced build time with a higher percentage of “Self-Perform” works
2017 OPTIMIZATION STUDY 2016 FEASIBILITY STUDY
Treatment Plant 94 63 Reagents and Services 14 9 Infrastructure and Tailings 71 46 Mining (includes pre-striping and $49m for equipment) 84 59 Construction Distributables 26 24 Management Costs 17 16 Owners Project Costs 66 59 Owners Operations Costs 5 4 Sub-Total 378 282 Contingency 34 26 Total 412 307
Capital Cost Estimate Summary in US$m
ITY CIL OPTIMIZATION STUDY
LIFE OF MINE PLAN
24
Item Unit LOM Total / Average Pre-prod 1 2 3 4 5 6 7 8 9 10 11 12 13 14 15 Mining Schedule Total Material Moved kt 166,752 15,555 16,000 16,000 16,000 16,000 16,000 13,770 12,661 15,908 13,623 10,143 5,092 Total Waste Moved kt 109,559 10,973 10,225 10,074 11,285 11,172 10,873 9,475 8,847 10,463 7,755 5,233 3,184 Total Ore Mined kt 57,193 4,582 5,775 5,926 4,715 4,828 5,127 4,296 3,814 5,445 5,868 4,910 1,908 Stripping Ratio w:o 1.92 2.39 1.77 1.70 2.39 2.31 2.12 2.21 2.32 1.92 1.32 1.07 1.67 0.00 0.00 0.00 Au Grade - Ore Mined g/t 1.57 1.70 2.05 1.78 1.87 1.65 1.88 1.20 1.37 1.38 1.30 1.12 1.08 0.00 0.00 0.00 Contained Gold - Ore Mined
2,882,942 250,292 380,473 339,552 284,028 256,057 309,845 165,566 167,586 240,798 246,064 176,249 66,432 Processing Schedule Total Ore Processed kt 57,000 4,000 4,000 4,000 4,000 4,000 4,000 4,000 4,000 4,000 4,000 4,000 4,000 4,000 4,000 1,000 Au Grade - Ore Processed g/t 1.57 2.26 2.32 2.21 1.87 1.99 1.80 1.37 1.57 1.84 1.32 1.45 0.98 0.72 0.53 0.42 Contained Gold - Ore Processed
2,874,932 291,115 298,991 283,905 240,735 256,406 231,939 176,705 201,293 236,809 170,115 186,579 125,818 92,339 68,735 13,447 Au Recovery % 85.8% 86.0% 83.7% 84.0% 88.3% 87.2% 86.7% 85.5% 80.2% 80.1% 93.3% 89.8% 89.9% 83.9% 85.8% 92.0% Recovered Gold
2,466,728 250,481 250,152 238,381 212,644 223,659 201,195 151,022 161,502 189,661 158,686 167,457 113,113 77,427 58,978 12,370 Payable Gold
2,464,261 250,231 249,902 238,143 212,431 223,435 200,994 150,871 161,341 189,471 158,527 167,289 113,000 77,349 58,919 12,358 Operating Cost Summary Mining & Rehandling US$/t Mined 2.89 2.42 3.21 3.05 3.23 2.92 3.50 2.70 2.80 2.86 2.36 2.34 3.07 0.00 0.00 0.00 Processing US$/t Ore Processed 11.96 11.54 12.41 12.48 12.20 12.50 12.39 12.16 12.36 11.56 11.27 10.72 12.37 12.06 11.52 11.68 General & Administrative US$/t Ore Processed 2.23 2.23 2.23 2.23 2.23 2.23 2.23 2.23 2.23 2.23 2.23 2.23 2.23 2.23 2.23 2.23 Cash Operating Costs (Net of Credits) US$/oz Gold Sold 504 345 414 426 489 447 544 602 556 506 517 426 630 788 1005 1332 Total Cash Costs US$/oz Gold Sold 554 395 464 476 539 497 594 652 606 556 567 476 680 838 1055 1382 All-In-Sustaining Costs US$/oz Gold Sold 580 407 484 493 567 532 612 677 643 598 602 500 716 864 1055 1382 Cash Flow Summary Gold Revenue $M 3,080 313 312 298 266 279 251 189 202 237 198 209 141 97 74 15 Less: Royalties, Credits, Transport & Refining $M (60) (6) (6) (6) (5) (5) (5) (4) (4) (5) (4) (4) (3) (2) (1) (0) Less: Cash Operating Costs $M (1,305) (93) (110) (108) (109) (106) (115) (95) (94) (101) (86) (76) (74) (63) (61) (17) Mining & Rehandling $M (496) (38) (51) (49) (52) (47) (56) (37) (35) (46) (32) (24) (16) (6) (6) (3) Processing $M (682) (46) (50) (50) (49) (50) (50) (49) (49) (46) (45) (43) (49) (48) (46) (12) General & Administrative $M (127) (9) (9) (9) (9) (9) (9) (9) (9) (9) (9) (9) (9) (9) (9) (2) Mine EBITDA $M 1,715 214 196 184 151 168 132 90 104 132 108 130 64 32 11 (2) Less: Sustaining Capital $M (63) (3) (5) (4) (6) (8) (4) (4) (6) (8) (6) (4) (4) (2) All-In-Sustaining Costs $M (1,428) (102) (121) (117) (120) (119) (123) (102) (104) (113) (95) (84) (81) (67) (62) (17) Sustaining Margin $M 1,652 211 191 180 145 160 128 86 98 124 103 125 60 30 11 (2) Less: Working Capital Movement $M (0) (11) (0) 1 (1) 3 (0) (1) 2 (1) 3 1 1 3 Less: Taxes $M (230) (3) (12) (14) (20) (30) (26) (13) (17) (24) (21) (29) (13) (5) (1) Less: Customs Duties & VAT $M FCF Before Non-Sustaining Capital $M 1,422 200 188 168 132 139 101 60 85 105 80 103 34 17 7 (1) Less: Non-Sustaining Capital $M (351) (351) Equipment Financing $M (77) (15) (15) (15) (15) (15) Reclamation and Salvage Costs $M (5) (3) Exploration $M Mine Free Cash Flow $M 990 (366) 184 173 153 117 139 101 60 85 105 80 103 34 17 5 (2)
ITY CIL OPTIMIZATION STUDY
25
PROCESS PLANT LAYOUT
Layout will utilize the Hounde design, however will be optimized for the increased throughput
ITY CIL OPTIMIZATION STUDY