Its about the children! 3 1 Regional Advisory Committee Meeting - - PDF document

it s about the children
SMART_READER_LITE
LIVE PREVIEW

Its about the children! 3 1 Regional Advisory Committee Meeting - - PDF document

Regional Advisory Committee Meeting Presentation October 23 25, 2011 1 Accountability Principles MISSOURI SCHOOL 4 IMPROVEMENT PROGRAM Regional Advisory Committee Meeting Accountability System Design Missouri Department of Elementary and


slide-1
SLIDE 1

Regional Advisory Committee Meeting Presentation October 23‐25, 2011 1

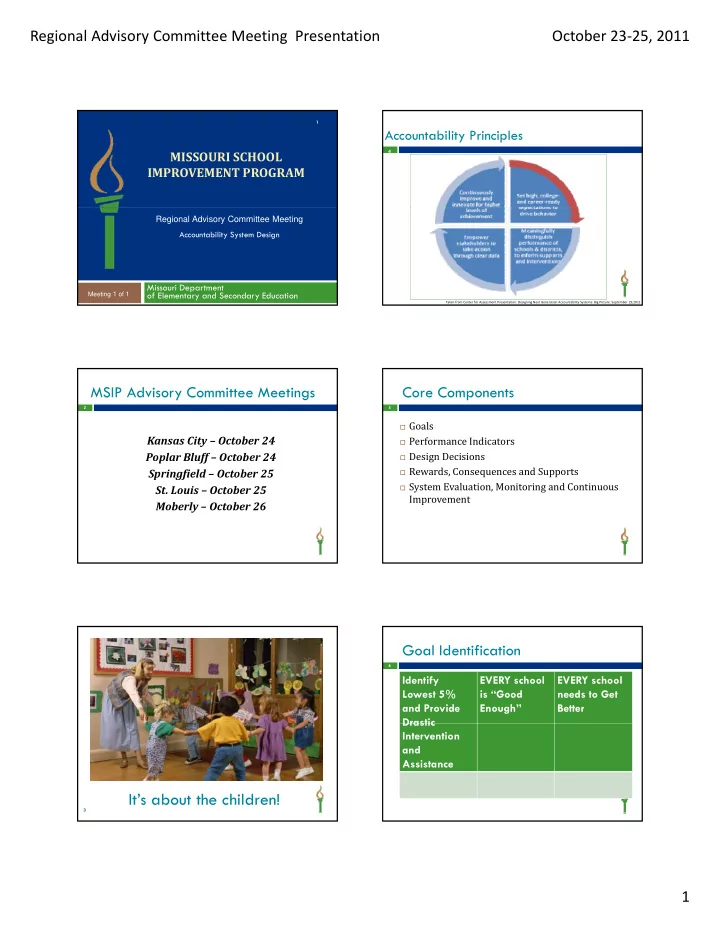
MISSOURI SCHOOL IMPROVEMENT PROGRAM

1

Regional Advisory Committee Meeting Accountability System Design

Meeting 1 of 1

Missouri Department

  • f Elementary and Secondary Education

MSIP Advisory Committee Meetings

Kansas City – October 24 Poplar Bluff – October 24

2

Springfield – October 25

  • St. Louis – October 25

Moberly – October 26

3

It’s about the children!

Accountability Principles

4

Taken from Center for Assessment Presentation: Designing Next Generation Accountability Systems: Big Picture. September 29,2011

Core Components

5

 Goals  Performance Indicators  Design Decisions  Rewards, Consequences and Supports  System Evaluation, Monitoring and Continuous

Improvement

Goal Identification

Identify Lowest 5% and Provide Drastic EVERY school is “Good Enough” EVERY school needs to Get Better

6

Drastic Intervention and Assistance

slide-2
SLIDE 2

Regional Advisory Committee Meeting Presentation October 23‐25, 2011 2

Small Group Discussion

7

Design Decisions

 Status vs. Growth  Differentiated vs. Standardized  Simple/Transparent vs. Complex/Precise  Focused Resources vs Resources for All

8

 Focused Resources vs. Resources for All

Consider desired distributions of student scores, accounting for target & variance among students

College and career

Starting point

End B – most/all students on target, variance same as start (could change relative position) End A – most/all students on target, little score variance End C – most/all students on target, more variance ready benchmark

Adapted from Center for Assessment Presentation: Designing Next Generation Accountability Systems: Big Picture. September 29,2011

Status vs. Improvement

High Status Low Growth High Status High Growth

10

Low Status Low Growth Low Status High Growth

Small Group Activity

Consequences

  • f Status

Status Growth

Consequences

  • f Growth

11

_______ % _______%

Small Group Activity

Consequences

  • f

Differentiated Accountability Differentiated Standardized Consequences

  • f

Standardized Accountability

12

y

_______ % _______%

slide-3
SLIDE 3

Regional Advisory Committee Meeting Presentation October 23‐25, 2011 3 Small Group Activity

Consequences

  • f Simple/

Transparent Systems Simple/ Transparent Complex/ Precise Consequences

  • f Complex/

Precise Systems

13

y

_______ % _______%

Small Group Activity

Consequences

  • f Focused

Department Resources

Focused Resources Resources for All

Consequences

  • f Department

Resources for all

14

_______ % _______%

Bringing It All Together

 How can multiple elements come together into a

clear coherent system?

 Balance the desire for simplicity and flexibility  Aligned to policy priorities (e g the metrics and

15

 Aligned to policy priorities (e.g. the metrics and

weights support state values)

 Support the need for utility (e.g. results that inform

practice)

Small Group Discussion

16