SLIDE 1
Chief Scientist Department of Conservation New Zealand (ghicks@doc.govt.nz)
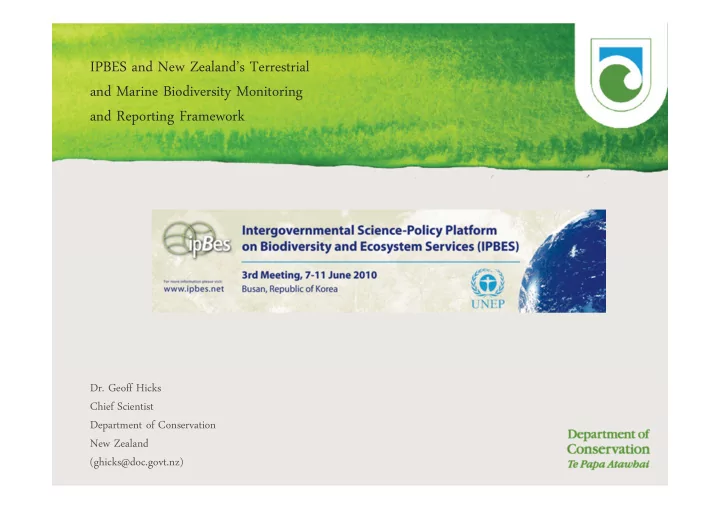
IPBES and New Zealand’s Terrestrial and Marine Biodiversity Monitoring and Reporting Framework
SLIDE 2
Convention on Biological Diversity
Article 25: Subsidiary Body on Scientific, Technical and Technological Advice (SBSTTA)
Functions:
a) Provide scientific assessments of biodiversity status b) Assessments of outcomes c) Knowledge development and science/technical transfer d) Provide advice e) Respond to questions
SLIDE 3
Busan outcome
“The new platform should perform regular and timely assessments of knowledge on biodiversity and ecosystem services and their interlinkages.”
SLIDE 4
Post-2010 Strategic Plan
Target 19: “By 2010, [knowledge, the science base and technologies relating to biodiversity, its values and functioning, its status and trends, and the consequences of its loss are improved, widely shared, and applied.][Technologies related to biodiversity are widely transferred to developing countries on preferential terms.]”
SLIDE 5
New Zealand and IPBES
1. Review and assess each country's methodologies for determining status and trends at national scale 2. Negotiate and internationally agree a set of defensible and consistently applied indicators and measures for accurate, standardised and globally consistent assessment of status and trends 3. Mechanisms to transfer evidence base to policy 4. Small set of metrics must be simple, meaningful, inexpensive to apply and readily transferable
SLIDE 6 New Zealand’s Natural Heritage Management System (NHMS)
- Responsible for $6.1 billion (book value) of public conservation land
- But we don’t know what’s happening to it (though we may think we do)
- Spend $135 million every year on biodiversity mgmt
- But we don’t know whether we’re doing the right things in the right places or what overall
difference that work is making
Growing pressure: national and international reporting obligations What’s the problem?
SLIDE 7 New Zealand’s Natural Heritage Management System (NHMS)
The Solution: National Monitoring and Reporting Scheme
- 1. National status and trends monitoring
- Measures overall status and trends in New Zealand’s
biodiversity
- Context for big decisions
Answers the NHMS questions: What is the state and condition of natural heritage? What are the trends in that condition?
- 2. Monitoring of managed species and places
- Monitors outcomes of active management
- Requires national consistency in project
monitoring Answers the NHMS questions: What difference does our management make? How can we improve management?
SLIDE 8 Monitoring outcome
Conserving natural heritage is maintaining
ecological integrity:
- Indigenous dominance (to maintain natural character)
- Species occupancy (to avoid extinctions)
- Ecosystem representation (to maintain ‘a full range’)
SLIDE 9 Measuring New Zealand’s ecosystem health
The Indicator Framework: a world first!
Ecological
Integrity Integrity
Indicators Case studies Desktop Other agencies NHMS products (improved) Sampling Scheme
LEGEND
Freshwater Freshwater
EI What is an indicator?
- Sales trends for business
- Blood pressure for health risks
- Pest dominance for ecological
health
Marine Marine
EI
SLIDE 10
An integrated monitoring system
Tier 3 Tier 2 Tier 1 Research Managed place monitoring Broadscale monitoring
SLIDE 11
Central curation of data Intranet now; Internet later
SLIDE 12 The National Sampling Scheme What is it?
- Annual sampling programme
- 1300 plots in 8 km grids over conservation land
- Five-yearly measurement cycles
- Others encouraged to do it too
- Long-term commitment
SLIDE 13
8x8 km grid and LUCAS plot locations
SLIDE 14
How it looks: layout of sampling locations
SLIDE 15
Layout of a sampling location
SLIDE 16 Measure
Kiwi call data from Northland (annual)
Back Transformed Fitted Values with Original Data
Time Back Transformed Fitted Values
10 20 30 40 2 4 6 8 10 12
Cathedral Diggers Vally
2 4 6 8 10 12
Glenbervie 7A Glenbervie 9A
2 4 6 8 10 12
Kaiaka Katui Marlow Road Marsden Cross Mimiwhangata
10 20 30 40
Mt Bledisioe
10 20 30 40
Paerata Puketi Puketi S R Puketotara Purua Rangitane Rarewarewa Sand Bay Takahue
10 20 30 40
Tiki-tikioure
10 20 30 40
Trounson
2 4 6 8 10 12
Waipoua L/out Waitangi No 12 fitted(model7)^2 Call
Statistical analysis workshops
SLIDE 17
Inventory Catalogue and classify
Marine Classification and information layers examples
National spatial layer for rocky reefs to 50m
SLIDE 18 NHMS Inventory & Monitoring Framework Marine examples
National Outcome Targeted National Outcome Outcome Objectives Indicator (examples) Potential measure (examples) Potential elements (examples)
Ecological integrity Indigenous dominance
- 1. Maintaining ecosystem processes
Ecosystem disruption Disease outbreaks Where data is otherwise gathered by DOC: the area or proportion of protected species impacted or number of individuals affected. E.g. mass mortality events, occurrence of disease in marine mammals.
- 2. Reducing exotic spread and
dominance Naturalisation of new weed and pest species Occurrence of self-maintaining populations of potential environmental weeds and pests The number, abundance and distribution of selected adventive species that have established themselves in New Zealand’s marine environment that pose a threat to managed marine sites. Data from MR monitoring and MAFBNZ.
- 3. Limiting environmental pollutants
Ecosystem levels of persistent toxins Toxins in selected environments and tissues of indigenous wildlife Persistent organic pollutants e.g. tissue samples from marine mammals, sea birds. Data from RCs.