
SLIDE 1
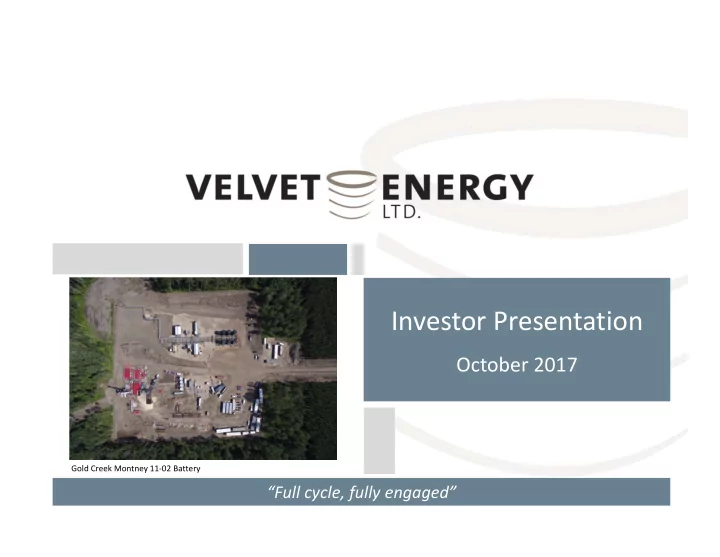
Investor Presentation
October 2017
“Full cycle, fully engaged”
Gold Creek Montney 11‐02 Battery
Investor Presentation October 2017 Gold Creek Montney 11 02 Battery - - PowerPoint PPT Presentation
Investor Presentation October 2017 Gold Creek Montney 11 02 Battery Full cycle, fully engaged ADVISORY REGARDING FORWARD LOOKING STATEMENTS This presentation contains certain forward looking information and statements with respect
Gold Creek Montney 11‐02 Battery
2
This presentation contains certain forward‐looking information and statements with respect to Velvet Energy Ltd. (“Velvet” or the “Company”), including expectations, beliefs, plans, goals, objectives, assumptions, information and statements about future events, conditions, results of operations, performance, Velvet’s planned capital expenditure program and the nature of the expenditures, drilling plans, expected drilling and completion costs, expected average production, the expected splits among crude oil, NGLs and natural gas, forecasted commodity prices and factors affecting natural gas prices, forecasted general and administrative expenses, interest expenses, revenue, operating income, operating netbacks, funds from operations and year‐end bank debt, management’s assessment of future potential, including years of drilling inventory and expectations with respect to natural gas demand and supply in North America.. These forward‐looking statements are based on assumptions and are subject to numerous risks and uncertainties, certain of which are beyond the Company’s control, including the impact of general economic conditions; industry conditions; volatility of commodity prices; currency exchange rates; imprecision of reserve estimates; environmental risks; competition from other explorers; stock market volatility; oil and natural gas development and transportation; actions by governmental authorities, including changes in government regulation, royalties and taxation; dependence upon compressors, gathering lines, pipelines and other facilities, certain of which the Company does not control; shortage or lack of available of pipeline capacity or other transportation facilities; weather conditions, natural disasters and fires; and ability to access sufficient capital. We caution that the foregoing list of risks and uncertainties is not exhaustive. The use of any of the words “anticipate”, “continue”, “estimate”, “expect”, “may”, “will”, “should”, “believe”, “plans”, and similar expressions are intended to identify forward‐looking information or statements Statements relating to “reserves” or “resources” are deemed to be forward‐looking statements as they involve the implied assessment, based on current estimates and assumptions that the reserves and resources can be profitably produced in the future. Readers are cautioned that disclosure of any well test results is not necessarily indicative of long‐term performance. Velvet’s actual results, performance or achievement could differ materially from those expressed or implied by these forward‐looking statements. No assurance can be given that any events anticipated herein will transpire or occur and such forward‐looking statements included in this presentation should not be unduly relied upon. In addition, the reader is cautioned that historical results are not necessarily indicative of future performance. The forward‐looking statements contained herein are made as of the date of this presentation and the Company does not intend, and does not assume any obligation, to update or revise any forward‐looking statements, whether as a result of new information, future events or otherwise, unless expressly required by applicable securities laws. Certain information set out herein may be considered as “financial outlook” within the meaning of applicable securities laws. The purpose of this financial outlook is to provide readers with disclosure regarding Velvet’s reasonable expectations as to the anticipated results of its proposed business activities for the periods indicated. Readers are cautioned that the financial outlook may not be appropriate for other purposes.
3
Velvet Edson Core 550 net sections Gold Creek Montney 245 net sections
4
5
been added via the drill bit
targets hurdle rate of return on Multiple
E&D capex efficiency with objective to reduce to below $14k/boe/d Daily Production
2011 2012 2013 2014 2015 2016 Capex ($mm) $39.5 $242.8 $110.7 $245.4 $108.3 $150.2 EBITDA ($mm) $24.4 $37.3 $87.3 $85.4 $84.6 Edson Wells drilled (G / N) 5 / 4.7 11 / 7.1 26 / 20.1 33 / 26.3 19 / 12.5 25/17.9 Success rate* (%) 79 80 92 82 92 94 2P FD&A cost ($/boe)** $33.51 $15.73 $13.22 $14.52 $14.33 $9.85
Note on acquisitions: 2012 capex included $195mm net acquisitions; $85mm in 2014 * Success rate is post completion ** FD&A includes change in FDC
5,000 10,000 15,000 20,000 25,000 Corporate Production (BOED)
Vero Acq 2012 2013 LTS Acq 2014 2015 2016 2017 Dev Montney
6
Ken Woolner, P.Eng, President & CEO Geoff MacDonald, P. Geol, Vice President, Exploration Jeremy Kwasnecha, P.Eng, Vice President, Operations George Gervais, P. Eng., MBA, Executive Vice President Chris Theal, CFA, CIM, Chief Financial Officer Peter Henry, CA, Vice President, Finance Ken Woolner, P.Eng, President & CEO John Brussa, Partner, Burnet, Duckworth & Palmer LLP Vincent Chahley, Independent Businessman Robert E. Hougie, 1901 Partners LP Jacob Strauss, Warburg Pincus Harvey Doerr, Independent Businessman Roger Smith, Independent Businessman Christopher R. Manning, Trilantic Capital Partners David B. Krieger, Warburg Pincus MANAGEMENT BOARD OF DIRECTORS
7
recognized as the low supply cost play in the Deep Basin by third parties
also adding and advancing prospects across the risk/entry cost spectrum:
8
Velvet Exploration & Development Portfolio
Conceptual Exploratory Development Exploitation
Play Maturity
Edson Ellerslie Edson stack
Relative Technical Risk
Gold Creek Montney RPC RPC RPC
RPC = Resource Play Concept
9
10
11
1000 Boe/d 500 Bbl/d
16‐14‐50‐13W5 (hz): 55 months: 3.5 Bcf, 195 mstb NGL, 214 mstb Oil
55 months
11‐14‐50‐13W5 (vt): 16 years, 396 Mmcf
100mcf/d 16 years
4‐33‐55‐17W5 2‐3‐53‐14W5 11‐14‐50‐13W5
12
Core from hundreds of wells were analyzed
permeability along the fairway = repeatable results Production on hundreds of vertical wells was analyzed
500 um
Porosity: 9%; Perm: 2.5 mD Offset Vt in 7 yrs: 0.137 bcf, 11 mstb Offset Hz in 36months:
500 um
Porosity: 7.8%; Perm: 0.4 mD Offset Vt in 16 yrs: 0.98 bcf, 30 mstb oil Offset Hz in 41 months:
500 um
Porosity: 14.2%; Perm: 1.0 mD Offset Vt in 16 yrs: 0.39 bcf Offset Hz in 44 months:
VEL Lower Mannville VEL 3D Seismic Images on right Shallow marine sand fairway
13
Edson Land and Ellerslie Resource Mapping
net acres
petroleum system
*Land as at September 30, 2017. Inventory numbers as of June 30, 2017
Play IRR (%) NPV10 ($mm) Current Inventory (G / N) Ellerslie 106 2.87 543/380 Notikewin / Falher 1‐mile 44 1.32 118/79 Wilrich Bayfill 1‐mile 47 1.64 102/77 Wilrich Shoreface TBD TBD 142/94 Bluesky 64 2.37 67 / 45 Rock Creek TBD TBD 51 / 31 Total Deep Basin 1,022/ 707
2017 Ellerslie Locations 2018 Ellerslie Locations 2019 Ellerslie Locations
to‐date
processing infrastructure
minimize unit operating costs
facility throughput
14
Ellerslie Locations Only
Repsol 4‐11 285 mmcf/d Velvet 16‐23 (100%) 23 mmcf/d ISH 10‐12 (1%) 23 mmcf/d Notine 7‐34 21 mmcf/d Velvet 12‐15 (100%) 29 mmcf/d Keyera 11‐10 (40%) 50 mmcf/d Velvet 8‐36 (72%) 23 mmcf/d Velvet 8‐6 (100%) 12 mmcf/d Pine Cliff 16‐12 (40%) 16 mmcf/d Velvet 9‐4 (100%) 10 mmcf/d Tidewater 4‐31 185 mmcf/d Velvet 16‐36 (55%) 14 mmcf/d
15
16 5 10 15 20 25 200 400 600 800 1000 2013 2014 2015 2016 ‐ H12016 ‐ H2 Stages Total TNE
Ellerslie Stage & Tonnage Trends
Total TNE Total Stages 500 1,000 1,500 2,000 100 200 300 400 500
2013 2014 2015 2016 ‐ H1 2016 ‐ H2
Total LB (000s) LB/ft
Ellerslie Proppant Intensity Trends
LB/ft Total Lb/well
$2.80 $2.35 $1.96 $1.62 $1.62 $1.60 $1.23 $1.28 $0.98 $1.10 $0.80 $1.05 $0.99 $0.65 $0.62 $0.62 $0.62 $0.65 0.0 1.0 2.0 3.0 4.0 5.0 6.0 Gross Well Cost (DCET $MM)
Ellerslie Well Cost
DRILL COMPLETE EQUIP/TIE $5.03 $4.28 $3.56 $3.34 $3.30 $3.04 * 2016 normalized for tonnage 22.0 18.6 13.3 10.1 7.6 9.0 0.0 5.0 10.0 15.0 20.0 25.0 2013 2014 2015 2016 BEST 2017 TARGET Spud to Rig Release
Ellerslie Drilling Days
0% 10% 20% 30% 40% 50% 60% 70% 80% 90% 100% $0.00 $5.00 $10.00 $15.00 $20.00 $25.00
PEY AAV PMT TOU BIR BNP CR VEL w/o MTG ARX VEL w MTG CKE PNE BXE VII CQE ERF SRX BTE TVE VET GTE WCP POU KEL RRX PGF TOG BNE NVA DEE JOY SGY CPG GXE OBE MQX SPE PXX CJ
% Liquids $/boe 2018 Opex + Transport 2018 % Liquids
17
2018 Opex + Transportation Cost vs. Liquids Weight
Source: Peters & Co research Peters restricted on VII; VII 1H17 was $10.21/boe
Comparable liquids weights VEL
100 200 300 400 500 600 700 800 1 2 3 4 5 6 7 8 9 10 11 12 13 14 15 16 17 18 19 20 21 22 23 24 Raw Oil Equivalent Production (boe/d)
Months
Average (47 Wells) ELRL Type Curve
18
Assumes AECO C$2.40/Gj. Sales volumes with shrinkage of 10%. Alberta Royalty Framework
IRR vs. Price Sensitivities EUR, IRR and Payout
IP30 EUR Gas (mmcf/d : bcf) 2.4 1.7 Oil (bbl/d : mbbl) 197 70 C3+ (bbl/mmcf : mboe) 98 67 Total (boe/d : mboe) 699 412 % Liquids 42% 33% DCET Cost mm 3.25 Chance of Success % 100 Payout yrs 1.3 RoR % 93 NPV10 mm 2.57 PV10 mm 5.82 F&D per boe 7.88 1 2 3 4 5 0% 50% 100% 150% 200% 250% $35 $40 $45 $50 $55 $60 $65 $70
NPV10 ($MM) IRR (%) WTI Oil Price ($/bbl)
Type Curve ‐ IRR Type Curve ‐ NPV10
19
Source: RS Energy Group, November 2016
20
21
22
Early adoption of leading‐edge technology
geological model Continuous improvement to establish top return oil play
23
TCPL/NOVA
MERITAGE PATTERSON CREEK
VELVET 11‐2 PAD:
VEL 4‐1 PAD:
VEL 11‐5 PAD:
CNRL GOLD CREEK CNRL WAPITI
VELVET ADVANTAGE Land: 245 net sections Geoscience:
VELVET 3D SEISMIC PIPELINE VELVET WELLS MONTNEY WELLS
24
Auditors PricewaterhouseCoopers, LLP Reservoir Engineers GLJ Petroleum Consultants Bankers Canadian Imperial Bank of Commerce Royal Bank of Canada Bank of Montreal The Toronto‐Dominion Bank Solicitors Burnet, Duckworth & Palmer LLP Velvet Energy Ltd. 1500, 308 4th Avenue SW Calgary, AB T2P 0H7 P: 403.781.9125 Investor contacts: investors@velvetenergy.ca