
SLIDE 1
INVESTOR PRESENT A TION
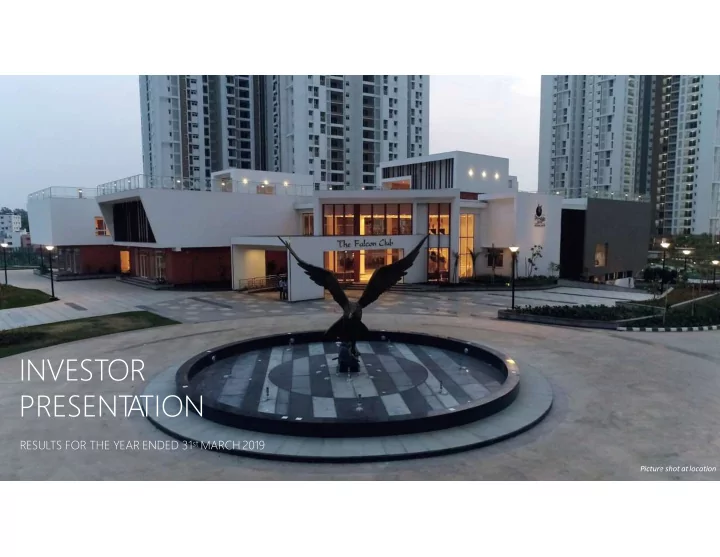
RESULTS FOR THE YEAR ENDED 31st MARCH 2019
Picture shot atlocation 1
INVESTOR PRESENT A TION RESULTS FOR THE YEAR ENDED 31 st MARCH - - PowerPoint PPT Presentation
INVESTOR PRESENT A TION RESULTS FOR THE YEAR ENDED 31 st MARCH 2019 Picture shot atlocation 1 Picture shot atlocation 2 2 INDEX Key Business About Annexures 3 4 1 2 Highlights Segments Prestige Group Residential Ongoing
INVESTOR PRESENT A TION
RESULTS FOR THE YEAR ENDED 31st MARCH 2019
Picture shot atlocation 1
2
Operational Highlights Financial Highlights
Key Highlights
Residential Office Retail/Malls Hospitality Property Management
Business Segments
Scale Business Model Credentials Board & Management Shareholding
About Prestige Group
Ongoing Projects UpcomingProjects Exit rental breakup
Annexures
1 2 3 4
Picture shot atlocation
2
2
Q4FY19 Operational Highlights
Up by10%yoy
Total Presales at ₹ 13726 mn (PY ₹ 12433 mn) Prestige Share ₹ 11222 mn
Up by36%yoy
Total Sales volume at 2.43 mn sft (PY 1.79 mn sft) Prestige Share 2.08 mnsft
Up by25%yoy
Annuity income at ₹ 1958mn (PY ₹ 1570 mn)
Total Collections at ₹ 12442 mn (PY ₹ 10516 mn) Prestige Share ₹ 9906 mn
3.47mn sft
Launched
0.42mn sft
Leased
Picture shot atlocation
3
Up by18%yoy 3 Picture shot at location
FY19 Operational Highlights
Up by38%yoy
Total Presales at ₹ 45571 mn (PY ₹ 33137mn) Prestige Share ₹ 36201 mn
Up by46%yoy
Total Sales volume at 7.09 mn sft (PY 4.84 mn sft) Prestige Share 5.74 mn sft
up by203%yoy
24 mn sft delivered across segments (PY 7.96 mn sft)
Up by21%yoy
Annuity income at ₹ 7487mn (PY ₹ 6194 mn)
Up by3%yoy Total Collections at ₹ 44085 mn (PY ₹ 42684mn) Prestige Share ₹ 35277 mn
6.63mn sft
Launched
1.77 mn sft
Leased
Picture shot atlocation
4
4 Picture shot at location
Q4FY19 Financial Highlights
Revenue ₹ 19943 mn EBITDA ₹ 5029 mn EBITDA% 25 % 7 %
Picture shot atlocation
5
PAT % PAT ₹ 1419 mn
5 Picture shot at location
FY19 Financial Highlights
Revenue ₹ 52841 mn EBITDA ₹ 15660 mn EBITDA% 30 % 8 %
Picture shot atlocation
6
PAT % PAT ₹ 4408 mn
6 Picture shot at location
7
Guidance vsAchieved
130% 118% 241% 103% 89% 66%
Pre Sales ₹ 45571
Guidance 35,000 –40,000
Prestige Group | Presentation | March 2019Collections Exit Rentals Launch ₹ 44085 ₹ 8255 6.63
Guidance Guidance Guidance 37,500 – 40,000 8,000- 8,250 10 mnsft
Completions 24.10
Guidance 10 to12
Leasing 1.77
Guidance 2 mnsft
Value in ₹ m n Volumeinmns f t 7
8
Guidance vsAchieved
151% 1.75
Turnover ₹ 52841
Guidance 35,000 –40,000
Prestige Group | Presentation | March 2019Debt/Equity(Consol) 1.3x
Guidance
Value in ₹ m n Volumeinmns f t 8
Completion
17 Projects completed , 10, 000 Homes delivered
FY 19
Project Name Area Project Name Area
1Cessna Business Park Block 9 0.67 10Prestige Mysore Central 0.11 2Prestige Logistic Centre 0.38 11Prestige Kingfisher Towers 1.15 3Prestige Ivy Terraces 0.64 12Prestige Royale Gardens 2.77 4Prestige Sunrise Park 3.33 13Prestige Spencer Heights 0.11 5Prestige Augusta Golf Village 1.36 14Prestige Ivy League 0.97 6Prestige Westwoods 1.34 15Prestige Central Street 0.19 7TMS Square 0.29 16Cessna Business Park Block 11 0.70 8Prestige Lakeside Habitat 8.90 17Forum Shantiniketan Mall 1.08 9Prestige Saleh Ahmed 0.10 Total 24.09
Picture Shot at Location
Prestige Group | Presentation | March 20199
9 Volumein mn s f t
7
Presales Growth T rendyoy
Areas are in Mn Sft Values are in Mn ₹
FY17
SALES
FY18 FY19
CAGR 36%
Prestige Group | Presentation | March 201910
10 24,585 33,137 45,571
Completions Growth T rend yoy
COMPLETIONS
FY17 FY18 FY19
CAGR 38%
12.74 7.96 24.10
3.47 mn sft | Q4F19 Launches
P l o t t e d D e v e l o p m e n t
Prestige Nirvana Hyderabad C o m m e r c i a l
Prestige Alpha Tech Pune C o m m e r c i a l
Prestige Cosmopolitan Chennai C o m m e r c i a l
Prestige Metropolitan Chennai
11
11
9
Leasing GrowthT rend yoy
Areas are in Mn Sft Values are in Mn ₹ 1.26 1.38 1.77 COMPLETIONS
FY17 FY18 FY19
CAGR 19%
Prestige Group | Presentation | March 201912
12
Annuity Income Growth T rend yoy
CAGR 17%
5,429 6,194 7,487 ANNUITY
FY17 FY18 FY19
13
Debt Profile
Notes, During Q1FY19 IND AS 115 has become applicable for the group, this has resulted in recognition of revenues from real estate activities
the extent of ₹ 74,656 Mn with consequential reduction in retained earnings as at the said date by ₹10,119 mn. In addition, during Q1FY19 the company has completed acquisition of CapitaLand’s stake in various SPVs for the consideration of ₹ 3420 Mn. This stake acquisition has further resulted in increase in the
Debt moved up from 71945 mn by 11,830 mn (yoy)
16%
Prestige Group | Presentation | March 2019DER at 1.75x As of Q4F19, Net Debt stood at ₹ 75,817 mn (Gross debt at ₹ 83,775 mn) and Networth at ₹ 43,386 mn.)
44% 3% 1% 10% 32% 10% Project debt - Resi. & Comm. Office Capex Retail Capex Hospitality Capex Rental Securitisation Loans Receivables Discounting loans
₹ 9599mn*
Exit RentalIncome
₹ 6313mn
Yielding Office Portfolio
₹ 3286mn
Yielding Retail Portfolio
Details Annexed
Pictures shot atlocation *Excludes Operating Hospitality income of Rs 3318 mn , GOP of40%
Revenue ₹ 3318 mn
GOP ₹ 1327 Mn
Hospitality
Office + Malls 14
14
2
Operational Highlights Financial Highlights
Key Highlights
Residential Office Retail/Malls Hospitality Property Management
Business Segments
Scale Business Model Credentials Board & Management Shareholding
About Prestige Group
Ongoing Projects UpcomingProjects Exit rental breakup
Annexures
1 2 3 4
Picture shot atlocation
15
15
Business Segment CF Summary*
₹ 17555mn
Office Rentals
Yielding: Rs 7232 Mn Pipeline: Rs 10323Mn
₹ 9077mn
Retail Rentals
Yielding: Rs 4343 Mn Pipeline : Rs 4734 Mn
₹ 4239mn
Hospitality Revenue
Yielding: Rs 3670Mn Pipeline : Rs 569Mn
₹ 12100 mn
Revenue, Property Management
Yielding: Rs 5826Mn Pipeline : Rs 6274Mn
29 mn sft
Land Bank Potential
*Estimates
₹ 132487 mn
FCF from
16
16
17
FCFfromUnderconstructionProjects
Category Area Value
Premium & Luxury Projects 1.08 11,577 Mid Income Projects 3.92 26,308 Commercial Projects 0.15 978 Completed Projects 3.49 28,721
Total 8.65 67,583 Particulars Area in Mn Sft ₹ Mn %
Total Developable Area 71.69 Car Park Area 19.25 Total Saleable Area 52.44 PG area share 40.43 Estimated Value 2,67,869 Sold 31.79 2,00,287 79 Collections 1,59,525 Balance to collect 40,762 Stock 8.65 67,583 21 Recovery from Land Owner
4,394 Free Cash flow to spend-A 1,12,738 Cost of Development 1,76,253 Incurred as of Q4F19 1,31,770 Balance to incur -B 44,483
Net Cash flow (A-B) 68,255
Stock
17
18
FCFfromUnderPlanningProjects*
Particulars Area in Mn Sft ₹ Mn
Total DevelopableArea 44.60 Car ParkArea 11.51 Total Saleable Area 33.09 PG areashare 27.28 Estimated Value-A 1,59,282 Cost of Development 1,07,115 Incurred as ofQ4F19 9,172 Balance to spend-B 97,943 RD Paid-C 2,893
Net Cash flow (A-B+C) 64,232
*Estimates 18
Snapshot
₹17,555 mn Annuity Rentals
Value in ₹ Mn, Arean in mnsft OPERATING UNDER CONSTRUCTION UPCOMING TOTAL GLA 10.25 4.45 7.04 21.75 EconomicInterest 8.92 3.06 5.39 17.37 Rentals p.a. ₹ 7,232 4,429 5,894 17,555 Economic Interest₹ 5,917 2,809 4,550 13,276
19
Prestige Group | Presentation | March 2019Picture shot atlocation *Estimates 19
8.5 mnsf Retail P
Snapshot
₹9077 mn Annuity Rentals
Value in ₹ Million OPERATING ONGOING UPCOMING TOTAL GLA 4.31 1.69 2.53 8.52 EconomicInterest 2.98 0.70 1.92 5.60 Rentals p.a.₹ 4,343 2,419 2,315 9,077 Economic Interest₹ 2,771 989 1,718 5,479
20
Prestige Group | Presentation | March 2019Picture shot atlocation *Estimates 20
Snapshot
₹4239 mn Revenue
Value in ₹ Million OPERATING UNDER CONSTRUCTION TOTAL TotalKeys 1,262 297 1,559 EconomicInterest 1,123 297 1,420 Total Revenue p.a.₹ 3,670 569 4,239 Economic Interest₹ 3,318 569 3,887
Prestige Group | Presentation | March 2019Picture shot atlocation *Estimates
21
21
Snapshot
Revenue from Property Management Portfolio*
107 mnsft Potential Area
Value in Rs Mn Revenue EBITDA Operating 5,826 1,052 Under Construction 2,663 479 Under Planning 3,611 650 Total 12100 2181
₹12100mn
22
Prestige Group | Presentation | March 2019Picture shot atlocation *Estimates 22
21
Operational Highlights Financial Highlights
Key Highlights
Residential Office Retail/Malls Hospitality Property Management
Business Segments
Scale Business Model Credentials Board & Management Shareholding
About Prestige Group
Ongoing Projects UpcomingProjects Exit rental breakup
Annexures
1 2 3 4
Picture shot atlocation
23
23
Picture shot atlocation
24
24 Shot at location
25
Projects Delivered
Delivered
shot atlocation 25
24
2 3 1 p r o j e c t s a c r o s s s e g m e n t s
64 Mn sft
Prestige Group | Presentation | March 201931 Mn sft 7 Mnsft 3 Mn sft 7 Mn sft
26
26
27
Residential Commercial Retail Hospitality Plotted Development Total Particulars Nos. Area Nos. Area Nos. Area Nos. Area Nos. Area Nos. Area CompletedProjects 99 64.11 106 31.47 10 7.12 8 2.55 8 7.42 231 112.67 OngoingProjects 34 37.36 11 7.84 3 2.42 1 1.11
48.73 UpcomingProjects 23 40.11 10 14.95 4 3.17
58.23 Land Bank/Dealpipeline
TOTAL 156 142 127 54 17 13 9 4 8 7 317 248.63
Prestige Group | Presentation | March 201927
28 49
MN SF
UNDER CONSTRUCTION
58
MN SF
UNDER PLANNING
29
MN SF
LAND BANK
28
26
RESIDENTIAL COMMERCIAL PROPERTY MANAGEMENT
− Office Space − Built-to-Suit Campuses − SEZs − IT Parks
RETAIL
HOSPIT ALITY
CONRAD SHERATON OAKWOOD J W MARIOTT ALOFT
Pictures shot atlocation
29
Prestige Group | Presentation | March 201929
30
300+ Awards & Recognitions
250+ AWARDS TOP INDIAN REAL EST ATE COMPANY CERTIFICATE OF EXCELLENCE MOST ADMIRED SHOPPING CENTER BUILDER OF THE YEAR DEVELOPER OF THE YEAR ADMIRED BRAND OF ASIA BEST RETAIL PROJECTS BEST RESIDENTIAL PROJECTS
Prestige Group | Presentation | March 2019MOST PROMISING BRAND …AND MANY MORE
30
31
Irfan Razack Chairman & ManagingDirector Rezwan Razack Joint ManagingDirector Noaman Razack Wholetime Director Uzma Irfan Director Jagdeesh K.Reddy Independent Director B.G. Koshy Independent Director Noor AhmedJaffer Independent Director
Independent
Prestige Group | Presentation | March 2019Director
31
32
Faiz Rezwan Executive Director- Contracts & Projects Zackria Hashim Executive Director- Land Acquisition Zaid Sadiq Executive Director- Liasion & Hospitality Anjum Jung Executive Director- Interior Design Nayeem Noor Executive Director- Government Relations Omer Bin Jung Executive Director- Hospitality Zayd Noaman Executive Director- CMD’s Office Venkat K Narayan Chief Executive Officer
Prestige Group | Presentation | March 201932
33
Suresh Singaravelu Executive Director- Retail, Hospitality Swaroop Anish Executive Director- Business Development Arvind Pai Executive Director-Legal
Executive Director – HR, IT & Admin
Prestige Group | Presentation | March 2019Executive Director- Projects & Planning V.V.B.S.Sarma Chief FinancialOfficer
33
34
1 Axis Capital Limited 2 Bank of America Merrill Lynch 3 Citigroup 4 CLSA 5 Elara Capital 6 Goldman Sachs 7 HDFC securities Promoters 70% FIIs 27% DIIs 2% Retail 1% 8 ICICI Securities 9 JM Financial 10 J.P . Morgan 11 Kotak Securities 12 Macquarie 13 Morgan Stanley 14 UBS & More….
34
33
Operational Highlights Financial Highlights
Key Highlights
Residential Office Retail/Malls Hospitality Property Management
Business Segments
Scale Business Model Credentials Board & Management Shareholding
About Prestige Group
Ongoing Projects UpcomingProjects Exit rental breakup
Annexures
1 2 3 4
Prestige Shot atlocation
35
35
36
77% 16% 5% 2% Residential Commercial Retail Hospitality
Projects UnderConstruction
1% 70% 4% 13% 8% 2% 2%
Ahmedabad Bengaluru Chennai Hyderabad Kochi Mangaluru Pune
Segment
Developable Area (Mnsf) Residential 34 37.36 Commercial 11 7.84 Retail 3 2.42 Hospitality 1 1.11 Total 49 48.73 State/City
Developable Area (Mnsf) Ahmedabad 1 0.43 Bengaluru 34 33.90 Chennai 4 1.93 Hyderabad 3 6.27 Kochi 5 4.01 Mangaluru 1 1.01 Pune 1 1.17 Total 49 48.73
36
37
69% 26% 5% Residential Commercial Retail
Projects UnderPlanning
82% 9% 3%2% 2% 2% Bengaluru Chennai Goa Hyderabad Kochi Mangaluru Mumbai Ooty Segment
Developable Area (Mnsf) Residential 23 40.11 Commercial 10 14.95 Retail 4 3.17 Total 37 58.23 State/City
Developable Area (Mnsf) Bengaluru 26 48.25 Chennai 2 5.28 Goa 1 0.22 Hyderabad 1 1.47 Kochi 2 1.14 Mangaluru 3 0.78 Mumbai 1 0.98 Ooty 1 0.10 Total 37 58.23
37
38
Picture shot atlocation
S.No Entity Name Location LandArea(Acres) PG Share PG Share (Acres) 1 Prestige Bidadi Holdings Pvt Ltd Bidadi,Bengaluru 143 100% 143 2 Prestige Estates Projects Ltd Bengaluru 2 100% 2 3 Village De Nandi Pvt Ltd Bengaluru 25 100% 25 4 Eden Investments Goa 74 78% 58 5 Perumbakam/Chennai Chennai 20 66% 13 6 Prestige Beta Bengaluru 20 80% 16 Total 284 257
284 Acres Land Bank
38
39
Total Economic Economic Area Leased S.No. Project Name Segment Leasable Area Interest (%) Interest (MnSf) Prestige Share Rent P.A. 1 Prestige Estates Projects Limited Commercial 2.03 100.00 2.03 2.03 976 2 West Palm Developers Pvt Ltd Commercial 0.32 61.00 0.20 0.20 90 3 Prestige Valley View Estates LLP Commercial 0.03 51.05 0.02 0.02 17 4 Exora Business Park -Phase I-III Commercial 2.18 100.00 2.18 2.18 1,638 5 ICBI India Pvt Ltd Commercial 0.06 82.57 0.05 0.05 59 6 Cessna (B1 to B9) Commercial 3.19 85.00 2.71 2.71 1,697 7 Prestige Polygon Commercial 0.33 100.00 0.33 0.33 320 8 Forum Vijaya-Commercial Commercial 0.19 50.00 0.10 0.10 57 9 SKN Commercial Commercial 0.24 100.00 0.24 0.24 194 10 Prestige Central Street Commercial 0.13 46.00 0.06 0.06 79 11 Prestige Trade Tower Commercial 0.50 33.80 0.17 0.17 305 12 Prestige Logistic Centre Commercial 0.26 100.00 0.26 0.26 54 13 Forum Celebration Mall Retail 0.39 100.00 0.39 0.39 229 14 Forum Mall Bengaluru Retail 0.35 79.90 0.28 0.28 458 15 UB City Retail Retail 0.10 45.00 0.04 0.04 198 16 The Forum Neighbourhood Mall Retail 0.29 100.00 0.29 0.29 261 17 Forum Vijaya Mall Retail 0.64 50.00 0.32 0.32 461 18 Forum Sujana Mall Hyderabad Retail 0.81 49.00 0.40 0.40 454 19 Forum Fiza Mall Retail 0.66 68.00 0.45 0.45 160 20 Forum Centre City Mall Retail 0.34 100.00 0.34 0.34 183 21 Prestige Mysore Central Retail 0.06 65.00 0.04 0.04 22 22 Forum Mall Shantiniketan Retail 0.64 64.00 0.41 0.41 344 Total annualised rentals 13.74 11.29 11.29 8,255
39
40
Total Economic Economic Area Leased S.No. Project Name Segment Leasable Area Interest (%) Interest (MnSf) Prestige Share Rent P.A. 1 Cessna Business Park B09 (Already Leased) Commercial 0.05 85 0.05 0.05 41 2 Cessna Business Park B10 (Already Leased) Commercial 0.48 85 0.41 0.41 391 3 Cessna Business Park B11 (Already Leased) Commercial 0.46 85 0.39 0.39 355 4 TMS Square –Cochin (Already Leased) Commercial 0.04 58 0.02 0.02 16 5 Prestige Logistic Centre (Already Leased) Commercial 0.12 100 0.12 0.12 24 6 Forum Sujana Mall Hyderabad (Bal. stake acquired) Retail 0.81 51 0.41 0.41 472 7 Prestige Cube (Already Leased) Retail 0.03 100 0.03 0.03 35 8 Prestige Mysore Central (Already Leased) Retail 0.02 65 0.02 0.02 10 Incremental rentals in FY 20 2.02 1.45 1.45 1,344 Total annualised rentals by March 2020 9,599
40
This presentation has been prepared by Prestige Estates Projects Limited (“Company”) solely for providing information about the Company. It contains certain forward looking statements concerning Prestige Estates Projects Ltd’s future business prospects and business profitability, which are subject to a number of risks and uncertainties and the actual results could materially differ from those in such forward looking statements. The risks and uncertainties relating to these statements include, but are not limited to, risks and uncertainties, regarding fluctuations in earnings, our ability to manage growth, competition, economic growth in India, ability to attract and retain highly skilled professionals, time and cost over runs on contracts, government policies and actions with respect to investments, fiscal deficits, regulation etc., interest and other fiscal cost generally prevailing in the economy. The company does not undertake to make any announcement in case any of these forward looking statements become materially incorrect in future or update any forward looking statements made from time to time on behalf of the company.
41
41
CONTACT
For any queries Please contact, E: investors@prestigeconstructions.com Registered Office- Prestige Estates Projects Limited, The Falcon House, No. 1, Main Guard Cross Road, Bangalore –560 001, T: +91 -80 –25001248, F: + 91 –80 -25591945, Website: www.prestigeconstructions.com
42
42