
SLIDE 1
Investment Opportunities in Thailand
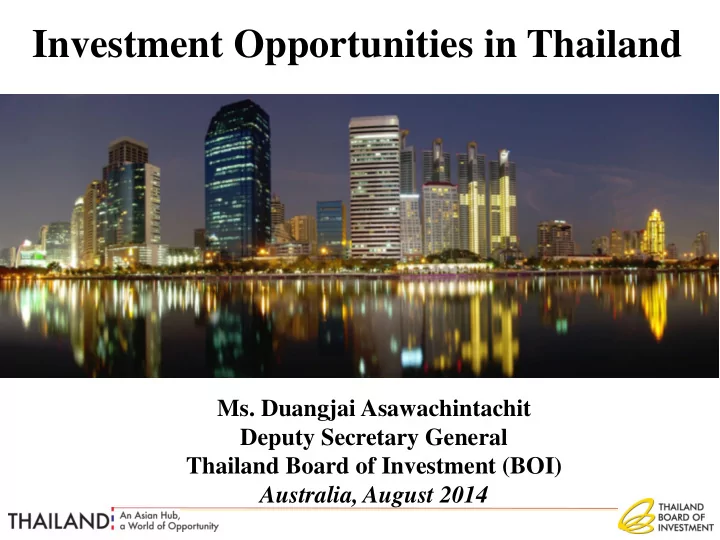
- Ms. Duangjai Asawachintachit
Deputy Secretary General Thailand Board of Investment (BOI) Australia, August 2014
Investment Opportunities in Thailand Ms. Duangjai Asawachintachit - - PowerPoint PPT Presentation
Investment Opportunities in Thailand Ms. Duangjai Asawachintachit Deputy Secretary General Thailand Board of Investment (BOI) Australia, August 2014 Presentation Outline Why Thailand Sectors of Opportunity Investment Policies and
Deputy Secretary General Thailand Board of Investment (BOI) Australia, August 2014
At the Center of Southeast Asia: Thailand is the World’s
ASEAN’s 2nd Largest Economy
UNCTAD’s Survey Top Ten Prospective Host Economies for 2013-2015
Country Rank China 1 USA 2 India 3 Indonesia 4 Brazil 5 Germany 6 Mexico 7 Thailand 8 UK 9 Japan 10
Source: UNCTAD Investment Prospect Survey, based on 159 company responses
2013 Country Manufacturing Competitiveness Index Rankings
Source: 2013 Global Manufacturing Competitiveness Index by Deloitte Touche Tohmatsu Ltd. and the U.S. Council on Competitiveness as of April , 2013
* ( ) = rankings
Source: Doing Business 2014, October 2013
Economic Projections 2012 2013 2014f Ave. Range
Real GDP
6.5 2.9 2.6 2.1-3.1
Export of goods & services (percent y-o-y)
3.1 4.2 4.4 3.4-5.4
Import of goods & services (percent y-o-y)
8.8 2.3 3.8 2.8-4.8
Current account (billion US dollar) % of GDP
4.7 1.1 3.7-5.7 0.8-1.4
Inflation (percent y-o-y)
3.0 2.2 2.5 2.0-3.0
Core inflation (percent y-o-y)
2.1 1.0 1.5 1.0-2.0
Unemployment (percent)
0.7 0.7 0.7 0.6-0.8
Source: Fiscal Policy Office, as of May 26, 2014
Source: UNCTAD and IMF as of April, 2014
8
GDP US$ 2.3 trillion
(A$2.5 trillion)
Population 616 million Foreign Direct Investment US$111 billion (A$119 bn) GDP Growth 5.7% (2011) 6.4% (2012) 5.2% (2013) 4.9% (2014)
ASEAN’s GDP to double to US$4.7 trillion (A$5
trillion) in 2020
10 Countries, One Single Market in 2015
Note:US$1=Bt32.45, A$1=Bt30.26 in Q2, 2014
(ASEAN Economic Community)
616 million population
(9% of world population)
GDP: US$2.5 trillion (A$2.7 trillion) (2% of world’s GDP)
(Regional Comprehensive Economic Partnership)
(ASEAN + China, Japan, Korea, India, Australia & NZ)
3.3 billion population (50% of world population) GDP: US$17.1 trillion (18.3 trillion) (27% of world’s GDP) FLAGSHIP OF ASEAN
THE BIGGEST FTA
Source: RCEP Seminar by DTN as of April 30, 2013Note:US$1=Bt32.45, A$1=Bt30.26 in Q2, 2014
Map is not drawn to actual size
USA ASEAN-MERCOSUR Thai-EU ASEAN-EU Thai-EFTA ASEAN-GCC ASEAN-India Thai-India BIMSTEC ASEAN-China ASEAN-Japan Thai-Japan ASEAN AEC Thai-Australia ASEAN-CER Thai-New Zealand
Suspended Under Study Ongoing Negotiations FTAs in Force
RCEP TPP
ASEAN-Korea
Pending Mandate
Ping Thong Industrial Estate Hemaraj Land and Development PLC Amata Industrial Estate Gateway City Industrial Estate Asia Industrial Estate Padaeng Industrial Estate Map Ta Phut Industrial Estate Laem Chabang Industrial Estate Wellgrow Industrial Estate
Golf Course
International School & University
Hospital
304 Industrial Park Rojana Industrial Park
Map of basic infrastructure sites and industrial parks in and around Bangkok
congestion in Bangkok
production bases in rural areas and neighboring countries
systems.
River
waterways
neighboring countries
Source: Thai PBS, June 13, 2014
Phase 1 Route (Bidding in 2013) Distance (km) Status (2010-14) Chachoengsao- Klong Sib Kao-Kaeng Koi 106 Under EIA proposal Lopburi-Nakornsawan 118 Mabkabal-Jira (Korat) 132 Jira-Khon Kaen 185 Nakorn Pathom- Hua Hin 165 Prachuab Kirikan - Chumporn 167 Total 873
Strategic Agenda: Modal Shift(8)
Phase 2 Route Distance (km) (2015-29) Kang Koy – Bua Yai 220 Jira-Ubon Ratchathani 309 Kong Kaen- Nongkhai 172 Nakorn Sawan-Tapanhin 69 Hua Hin - Prachuabkirikhan 89 Chumporn-Surat Thani 166 Total 1,025
Phase 3 Route Distance (km)
(2020-25)
Tapanhin-Chiang Mai 427 Surat Thani-Padangbesa 339 Klong 19-Kabin Buri 76 Hat Yai-Sugaikolok 214 Thungsong-Kantrang 93 Krabin Buri-Klongluk 98 Total 1,247
Source: OTP, Ministry of Transport, as of Apr 24, 2014
Phase 1 (78 km) Phase 2 (106 km)
รถไฟทางคู่ในปัจจุบัน Current railway for goods transportation
Chachoengsao-Sriracha-Laem Chabang (already started commercial operation since Jan 12, 2012)
Speed up the project to support particularly in Eastern Seaboard area with a total distance of 184 km.
Chachoengsao=Klongsibkao-Kang Khoi (Preparation for bidding)
Source: Office of transport and traffic policy and planning, Ministr of Transport as of Apr 24, 2014
Source Ministry of Transport, as of Feb 2011
2014 2013 4 5 Singapore 7 3 Tokyo 14 13 Seoul 66 57 Yangon 88 66 Bangkok 115 111 Kuala Lumpur 119 71 Jakarta 131 134 Hanoi 169 177 Phnom Penh
Source: Mercer Cost of Living 2014
(Ranking out of total 211 cities)
Bangkok (88) drops 22 places from last year Thailand: Low Cost of Living
Source: KPMG ASEAN Tax Guide, as of 2013
Income Taxed amount Tax rate Old New 0-150,000 150,000 Exempted Exempted 150,001-300,000 150,000 10% 5% 300,001-500,000 200,000 10% 10% 500,001-750,000 250,000 20% 15% 750,001-1,000,000 250,000 20% 20% 1,000,001-2,000,000 1,000,000 30% 25% 2,000,001-4,000,000 2,000,000 30% 30% More than 4,000,000
35%
Note: The new tax rate will be applied for 2013 tax calendar year onwards.
Source: http://www.rd.go.th/publish/fileadmin/download/taxrate_pit2556.pdf as of Jan 2014
Description M2 Costs (THB) M2 Costs (A$1=30.26THB) Industrial Building Standard Low Rise Factory 15,000 -19,000 $496 - $628 Electrical Power Systems 5400 $178 Office (Construction) High Quality 28,000 - 33,000 $925 - $1,091 Medium Quality 23,000 - 28,000 $760 - $925 *Includes transformer, Main DB and Sub DB for general factory & office electrics only. Excludes production equipment/machinery power. **Includes cost of communal air conditioning, general electrics and sanitary. Source: Tractus Asia/updated May 2014
0.5 0.3 0.6 0.2 0.0 0.6 9.8 6.3 1.2 2.2 3.0 8.6
2 4 6 8 10 Total Japan EU USA S.Korea China
A$ Billion
2013 (Jan-Jul) 2014 (Jan-Jul)
Source: BOI, as of Aug 19, 2014 Note:A$1=Bt30.26 in Q2, 2014
208 18 30 109 107 110 147 80 35 428 23 31
15 14 11 22 25 22 16 18 22 25 23 19 100 200 300 400 500
2003 2004 2005 2006 2007 2008 2009 2010 2011 2012 2013 2014 (Jan- Jul) A$ Million
5 10 15 20 25 30
Value No.of Projects Source: BOI, as of Aug 19, 2014 Note:A$1=Bt30.26 in Q2, 2014
Sector Projects A$ Million Agriculture
15 91.3
Minerals and Ceramics
3 176.7
Light Industry
17 31.5
Auto and Metal Processing
44 130.5
Electrical and Electronics
23 22.1
Petrochemicals, Chemicals
13 55.5
Services and Infrastructure
30 346.0
TOTAL
145 853.7
Source: BOI, as of Aug 19, 2014 Note:A$1=Bt30.26 in Q2, 2014
3.27 4.20 5.46 6.76 8.70 9.65 9.82 7.97 9.97 10.33 4.53 2.94 4.32 4.32 4.37 5.68 4.35 6.25 8.00 5.62 5.56 2.91
6.2 8.5 9.8 11.1 14.4 14.0 16.1 16.0 15.6 15.9 7.4 3 6 9 12
2004 2005 2006 2007 2008 2009 2010 2011 2012 2013 2014 (Jan-Jun)
A$ Billion 5 10 15 20 A$ Billion
Export Import Total
Source: MOC, as of Aug 19, 2014 Note:A$1=Bt30.26 in Q2, 2014
Description 2011 2012 2013 2013 (Jan-Jun) 2014 (Jan-Jun) % Change YOY
Motor cars, parts and accessories 2,570.9 3,807.0 4,416.3 2,300.3 1,967.3
Polymers of ethylene, propylene, etc in primary forms 328.1 344.8 420.2 199.8 201.8 1.03 Iron and steel and their products 268.8 658.9 840.7 514.5 191.1
Air conditioning machine and parts thereof 364.9 393.5 388.8 154.0 167.0 8.41 Prepared or preserved fish, crustaceans, molluscs in airtight 301.9 352.7 326.7 150.6 153.6 2.00 Others 4,130.9 4,416.7 3,938.9 1,771.5 1,844.5 4.12 Total 7,965.6 9,973.7 10,331.5 5,090.6 4,525.3
Unit: A$ million
Source: MOC, as of Aug 19, 2014 Note:A$1=Bt30.26 in Q2, 2014
Description 2011 2012 2013 2013 (Jan-Jun) 2014 (Jan-Jun) % Change YOY
Crude oil 2,047.9 1,286.8 1,240.3 469.2 1,216.3 159.26 Other metal ores, metal waste scrap, and products 865.1 1,132.5 803.4 448.6 348.0
Jewellery including silver bars and gold 2,834.9 991.4 1,394.3 996.0 285.8
Coal 201.8 244.9 287.4 129.2 173.8 34.54 Vegetables and vegetable products 313.0 547.2 257.0 177.8 163.5
Others 1,738.2 1,421.5 1,576.9 763.0 726.7
Total 8,000.9 5,624.4 5,559.3 2,983.7 2,914.1
Unit: A$ million
Source: MOC, as of Aug 19, 2014 Note:A$1=Bt30.26 in Q2, 2014
Target Industries Agriculture and food processing Automotiv e Machinery Mold & Die
Target Industries Biotechnology Alternative energy E&E
Natural: Solar, Hydro, Wind Crop: Sugar Cane, Cassava, Palm Waste: Agricultural Waste, Industrial Waste, Municipal Waste
Source: National Food Institute 2012
1
generation value-creator.
2
3
4
5
level) within 20 years.
Source: DEDE (Renewable Energy Asia 2012), as of Sept 12, 2012.
Growing Opportunities: Renewable & Alternative Energy
Abundant Agricultural Raw Materials
Sufficient and Improved Infrastructure
The Most Optimal Location for Business and Living Condition High Level of Local Technical Expertise and an Established Legislative Framework for the Renewable Sector
As of July 22, 2014
Thailand’s solar target (AEDP2012-2021) highest among ASEAN countries. Highest growth rate among all renewable energy. Strong investor’s interest- more opportunities for market expansion.
(as of Dec 2013)
868.97 4.25 389.13 529.64 41 310 85
Proposed Accepted (waiting to sign PPAs) PPA signed (not yet connected) Connected and selling to the grid
Solar Installed Capacity (MW)
VSPP SPP
Source: Seminar on Renewable Energy Technology Implementation in Thailand Experience Transfer from Europe by EPPO & ERC as of December 2013
Total Projects: SPP: 7 (436 MW) VSPP: 458 (1,791.98 MW)
Type of renewable energy (July 2010-Present) Adder (B/kWh) VSPP SPP Special adder * (B/kWh) Supporting period (Year) Biomass
0.50 0.30 Bidding 1.00 1.00 7 7
Biogas (all categories of production sources)
0.50 0.30
Bidding 1.00 1.00 7 7
Waste (community waste, not hazardous industrial waste, and inorganic waste)
2.50 3.50 2.50 3.50 1.00 1.00 7 7
Wind power
4.50 3.50 3.50 1.50 1.50 10 10
Mini and micro hydropower
0.80 1.50
1.00 1.00 7 7 Solar Cell 6.5 1.50 10
* Note : Special Adders for
and 4 districts in Songkhla
Source: EEF Annual Seminar by DEDE as of Aug 19, 2013 Note: 4 districts in Songkhla province including Chana, Thepha, Saba Yoi, and Nathawi
Solar PV Rooftop (200 MW) Capacity Feed-in-Tariff (25 yrs.) Bt/kWh Residential project (100 MW) < 10 kW 6.96 (A$0.23) Commercial building (100 MW) Small 10-250 kW 6.55(A$0.22) Medium/ Large 250-1,000 kW 6.16(A$0.20)
Capacity target
Responsible unit
Commission (ERC) Action
has to be installed by 2014
Source: Recent Developments and a Future of Thailand’s Renewable Energy as
Community Solar Owned System Promotion (800 MW)
Subsidies period (years) Feed-in-Tariff Bt/kWh Community revenue prospect (Bt million) 1-3 9.75 (A$0.32) 2.04 (A$67,413) 4-10 6.50 (A$0.21) 1.97 (A$65,100) 11-25 4.50 (A$0.15) 3.97 (A$131,191) Revenue total 7.95 (A$262,713) Capacity target
Subsidy
800 MW worth of “ground- mounted community owned solar who can allocate 1 MW per local sub district.
Action
plants must be installed by 2014.
Source: Recent Developments and a Future of Thailand’s Renewable Energy as of Aug 14, 2013 Note:A$1=Bt30.26 in Q2, 2014
Alternative Energy Development Plan (AEDP) 2012-2021
Renewable Energy ( 13,924 MW) Solar power 3,000 MW Wind power 1,800 MW Hydro power 324 MW MSW 400 MW Biomass 4,800 MW Biogas 3,600 MW New forms of RE (3 MW) Geothermal energy 1 MW Wave and Tides 2 MW
AEDP 2012-2021, targeting to replace 25% of total fossil-fuel consumption with RE at the end of 2021.
Source: Ministry of Energy, as of Aug 19, 2013
Source: www.dede.go.th as of June 20, 2014 Note: Traditional renewable energy consists of fuel wood, charcoal, paddy husk, and agricultural waste using in residential and industrial households.
1.18 Manufacture of alcohol or fuel from agricultural products, including scrap, garbage and/or waste 4.2.3 Manufacture of energy-conserving machinery or equipment or machinery which uses alternative energy 4.15 Manufacture of fuel cells
Renewable Energy
7.1.1 Production of electricity or steam power using alternative energy such as energy from agricultural materials, biogas and wind energy
5.5.10 Manufacture of solar cells and raw materials for solar cells
Source: BOI Announcement No.2/2553, April 23, 2010
9th largest automobile producer in the world in 2013 14 assemblers with a combined production of more than 2,000,000 in 2012 High Local content of up to 90% Target of 3 million units in 2017
(Units of production)
Source: OICA as of March, 2014
World’s Production: 87.24 Million (+3.6%) Thailand : 2.53 Million (+4.3%) #9 in World’s Automotive Production #1 in ASEAN for Automotive Production
Thailand
& Eco-Car
Indonesia
Truck
Philippines
Vietnam
Malaysia
Thailand: No. 1 ASEAN’s Automotive Production Base
ASEAN Key Indicators 2013 Population 616 million GDP
GDP
Car Production
Car Total Sales
Source: ASEAN Automotive Federation
Thai Automotive Cluster and Supply Chain Structure
Tier 2 & 3 Tier 1
Manufacturer
Parts Manufacturers 450,000 persons Supporting Industries 100,000 persons
Passenger & Pick-up (17 companies, 23 factories) Motorcycle (8 companies, 8 factories)
SME (1,700 companies)
Stamping, plastics, rubber, machining, casting, forging, function, electrical, trimming
Engines ,Drivetrains, Steering, Suspension, Brake Wheel, Tire, Bodyworks, Interiors, Electronics and Elec Systems
Vehicle Parts (386 companies) Motorcycle Parts (201 companies) Vehicle & Motorcycle Parts (122 companies) *Vehicles 100,000 persons
200,000 persons
Associations / Institutes Universities / Technical Colleges
Government
Upstream Industry
Steel, Plastic, Rubber, Electronics, Glass, Textile, Leather, Chemical, Oil, Coating and Gulvanize Policy & Supporting Body
Service Industry SUPPORTING INDUSTRY
MACHINERY, EQUIPMENT&DEVICE, MOLD & DIE, JIG & FIXTURE
Japanese Global Suppliers 28/29 Companies 29/71 Companies Other Global Suppliers
Manufacture of passenger cars
Condition:
the first five years of operation.
must not be less than 15 billion baht, excluding cost of land and working capital.
submitted and approved by the Board. Rights and benefits:
No.1/2543 dated Aug 1, 2000.
Source: A Guide to BOI Investment as of Nov 24,2011
All Zones
Import duty Exemption
Import duty Exemption for Export
ABS Substrate for catalytic converters Electronic fuel injection systems Automobile transmission Battery for electric-powered vehicles
Traction motor for automobile such as hybrid or fuel cell cars
Electronic Stability Control(ESC) Regenerative Braking System Electric air conditioning system for automobile Rubber tires for vehicles Aircraft tread tires Electronic parts for vehicles
60
Thai Automotive Industry Milestones
1st Milestone 1 million units Rank 15th 2nd Milestone
2.45 million units Rank Top 10
“Thailand is a global green automotive production base with strong domestic supply chains which create high value added for the country”
3rd Milestone 3 million units
Source: The Thai Automotive Industry Association (TAIA)
Source: IMC Institute 2014 and National Broadcasting and Telecommunications Commission (NBTC) as of June 24, 2014
Internet Users: 23.86 million, a 35.8% penetration rate(2013) Broadband Subscribers: 5.1 million homes (Q1, 2014) Facebook Users: 26 millions (2013) Mobile Subscribers: 96.4 million (including Post-Paid and Pre-paid in Q1, 2014) Mobile Penetration: 144.36% (Q1, 2014)
that is crucial to the country’s development.
incentives offered by the BOI regardless of location, irrespective
– A maximum corporate income tax exemption of 8 years with no cap on the amount exempted;
– The BOI also offers many other zone-based incentives, including
transport costs for up to 10 years in Zone 3.
World’s # 1 Cassava Exports World’s # 2 Sugar Exports World’s # 3 Fishery Exports World’s # 6 Rice & Grains Exports
1.11.8 Manufacture or preservation of ready-to-eat or semi-ready-to-eat food is classified as a priority activity of special importance and benefits to the country. Conditions: – Products must use modern technology, production process, tools and equipment and inspection (current or innovative technology)*. Rights and benefits: – Exemption of import duty on machinery for all zones. – Eight-year corporate income tax exemption for all zones with no cap. – Other relevant location-based incentives.
* Ref. BOI Announcement No.Por1/2553-Scope of Products under the Investment Promotion Activity Category 1.11.8 Manufacture or Preservation of Ready-to-Eat or Semi Ready-to-Eat Food.
BOI ZONING AND INCENTIVES
Zone: 1 2 3 Incentives: Lower Higher
Import Duty Privileges Outside I.E Inside I.E Zone 1 50% Reduction 50% Reduction Zone 2 50% Reduction Exempt Zone 3 Exempt Exempt Corporate Income Tax Outside I.E Inside I.E Zone 1 No Privilege 3 years Zone 2 3 years 7 years Zone 3 8 years 8 years
BOI’s Liberal Investment Regime & Attractive Investment Incentives
100% foreign
No local content requirements No export requirements No restriction on foreign currency
Import duty exemptions/ reductions on machinery & raw materials Corporate Income Tax/ Exemption for 3 to 8 years 50% reduction of corporate income tax for up to 5 years Double deduction on utility costs Deductions for qualifying infrastructure costs
Land ownership rights Work permit & visa facilitation
sector
concentration
Source: Investment Strategy and Policy Bureau, Thailand BOI
Driving Skill, Technology and Innovation Investment through Investment Incentives Incentives: Additional 1-3 years of tax holidays Criteria: Investments and expenditures on
91
Overseas offices Country desks 1-Stop for visas & work permits: work permits in 3 hours Interaction with other govt. agencies
Industrial Subcontracting Services Vendors meet customers program (BUILD Unit) Investment Matchmaking Program ASEAN Supporting Industry Database BOI SUPPORT SERVICES
92
18th Floor, Chamchuri Square Building 319 Phayathai Road, Pathumwan Domestic Call: 0 2209 1100, Inter. Call: (66 2) 209 1100 Email: osos@boi.go.th
More Convenience, less time, more efficiency!