Investigation of the South Atlantic Magnetic Anomaly By Rebecca - - PDF document

investigation of the south atlantic magnetic anomaly
SMART_READER_LITE
LIVE PREVIEW

Investigation of the South Atlantic Magnetic Anomaly By Rebecca - - PDF document

Investigation of the South Atlantic Magnetic Anomaly By Rebecca Humble Supervised by Ian Whittaker, Department of Physics at NTU Introduction Within this Physics Undergraduate Research Project, the data used was retrieved from orbiting


slide-1
SLIDE 1

Investigation of the South Atlantic Magnetic Anomaly

By Rebecca Humble Supervised by Ian Whittaker, Department of Physics at NTU

Within this Physics Undergraduate Research Project, the data used was retrieved from orbiting satellites in

  • rder to plot intensity of energetic

particles across the parameters of the

  • Earth. This represented the extent and

characteristics of the South Atlantic Magnetic Anomaly, and suggested what can be further investigated in the future.

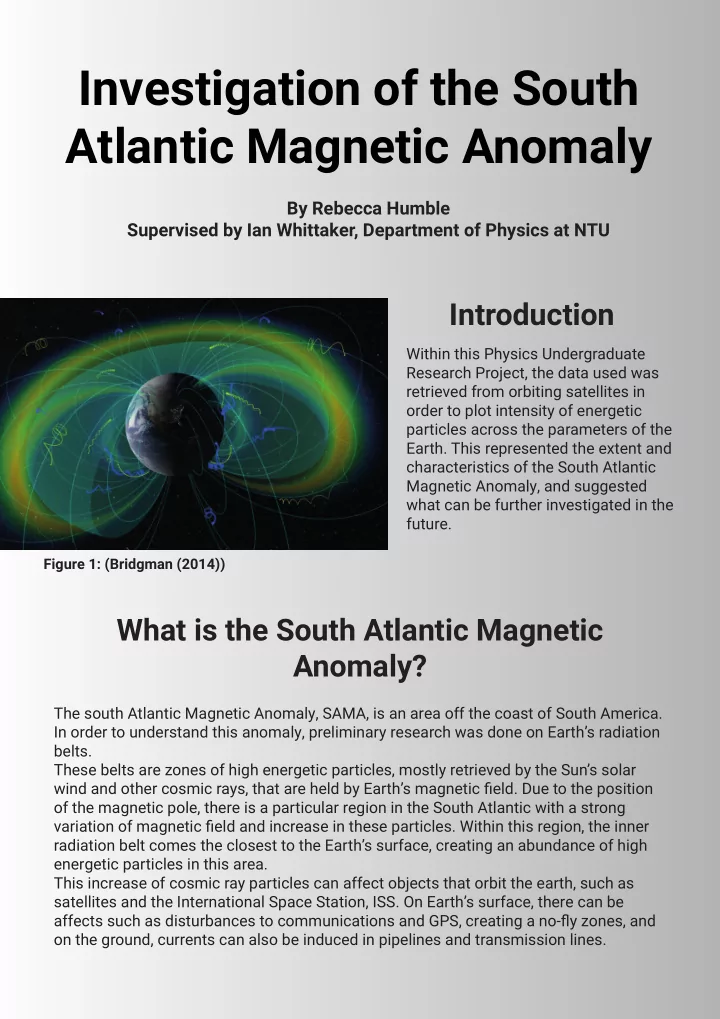
Figure 1: (Bridgman (2014))

Introduction What is the South Atlantic Magnetic Anomaly?

The south Atlantic Magnetic Anomaly, SAMA, is an area off the coast of South America. In order to understand this anomaly, preliminary research was done on Earth’s radiation belts. These belts are zones of high energetic particles, mostly retrieved by the Sun’s solar wind and other cosmic rays, that are held by Earth’s magnetic fjeld. Due to the position

  • f the magnetic pole, there is a particular region in the South Atlantic with a strong

variation of magnetic fjeld and increase in these particles. Within this region, the inner radiation belt comes the closest to the Earth’s surface, creating an abundance of high energetic particles in this area. This increase of cosmic ray particles can affect objects that orbit the earth, such as satellites and the International Space Station, ISS. On Earth’s surface, there can be affects such as disturbances to communications and GPS, creating a no-fmy zones, and

  • n the ground, currents can also be induced in pipelines and transmission lines.
slide-2
SLIDE 2

The aims of this study was to determine the size and variation of the South Atlantic Magnetic Anomaly. In order to do this, data was taken from the French DEMETER mission to produce maps of particle precipitation at different orbital periods. This involved programming data through MATLAB, a platform specifjcally designed for engineers and scientists. All the data used spans over a 5 years period, the length

  • f the DEMETER mission.

To visually see the SAMA, a minimum

  • f 1-month worth of data fjles needed

to analyzed and plotted. All these fjles contained a vast amount of data, not all

  • f which was needed. In order to only pull
  • ut certain variables, a code was written

that could sift through the fjles, saving only specifjc data. This information included orbital parameters, this being the position of the satellite around the earth in longitude and latitude values. Next was the orbital time, given in Julian date, the number of days since 1st January 4713 BC. This then needed to be converted into modern calendar days. Then fjnally, the fmux. This is the intensity of energetic particles given at

  • ver 120 wavelengths.

Figure 2 is a plot of the average fmux

  • ver the course of an entire year, this

specifjcally being 2005. The colour bar, set to the maximum intensity recorded by the satellite, represents the average value in each area set to a 1 degree accuracy. This representation shows the radiation belts as two sinusoidal waves at the top and bottom

  • f the plot.

Aims Method

Figure 2: 2005 SAMA plot

As well as a bulging area of intensity between 100 - 230 degrees latitude, this being the SAMA, it also shows the area above the anomaly is empty of energetic

  • particles. This is due to the particles in at

the South Atlantic region travelling into our upper atmosphere, and not being able to bounce back. Figure 3 shows a plot of the log_10 average intensity over the course of a

  • year. , which allowed for more accurate

measurements of the expanse of the anomaly, while keeping record of the size and variation with the changing months.

Log10(Intensity) 2004

Figure 3: Log10(Intensity) 2004

slide-3
SLIDE 3

Findings

The results of the coding process were verifjed on a global scale as shown in the fjgure above, the fmuxes have values within an expected range and the general shape of the radiation belts is present. The focus of the study could then proceed to the South Atlantic Anomaly itself. The disturbance storm time index, Dst, measures geomagnetic activity, used to assess the severity of magnetic storms. Figure 4 and 6 are two graphs representing two different months worth of Dst data, October and November 2004. Figure 5 and 7 are the plots of the average fmux in each of them months.

Figure 4: Oct 2004 Dst Figure 6: Nov 2004 Dst Figure 5: Oct 2004 SAMA plot Figure 7: Nov 2004 SAMA plot

When the Dst value is lower than -50 nanotesla, that signifjes a geomagnetic storm, suggesting an increased fmuctuation in the magnetic fjeld. As shown in November 2004, this increases the intensity of the energetic particles not only in the region of the SAMA but also throughout the radiation belts. What you can also visually see is how the SAMA seems to have two higher intensity peaks within the region.

Further Research

Further research into the investigation of the SAMA could focus specifjcally on what causes this region of high energetic particles to split into two high intensity peaks. A good starting point would be focusing on the timeframes where this seems to occur in previous research, looking for possible factors which may encourage this. Furthermore, more in detail of the specifjc processes going on could be investigated, helping to prevent current affects the anomaly has on ground, in the air and in space.