
SLIDE 1
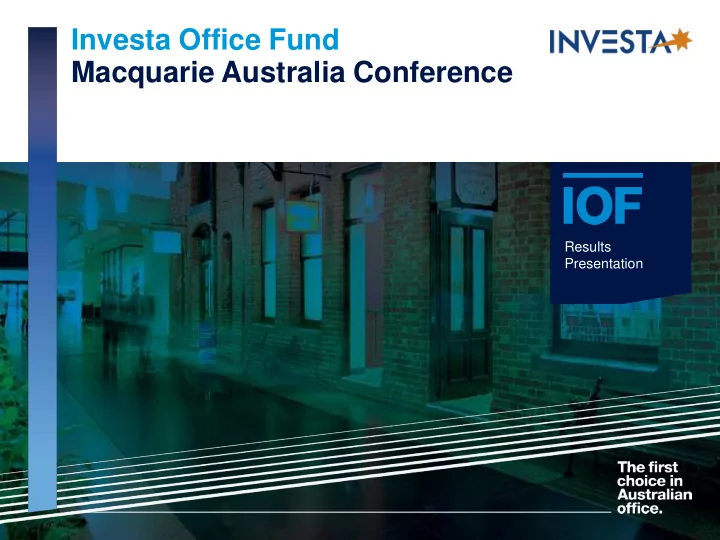
Investa Office Fund Macquarie Australia Conference
19 February 2015
Results Presentation
Investa Office Fund Macquarie Australia Conference Results 19 - - PowerPoint PPT Presentation
Investa Office Fund Macquarie Australia Conference Results 19 February 2015 Presentation Highlights Investa continues to deliver Financial > Net profit $99.5 million (up 78%) > FFO 14.2 cpu (up 3%) and DPU 9.55 cpu (up 3%) > Full
19 February 2015
Results Presentation
> Net profit $99.5 million (up 78%) > FFO 14.2 cpu (up 3%) and DPU 9.55 cpu (up 3%) > Full year guidance upgraded from 27.3 cpu to 27.5 cpu – 3.8% growth on FY14 > NTA up 7 cents to $3.42 > Another active period of leasing, with 30,000 sqm leased – including 11,400 sqm in Brisbane – de-risking the outlook > Progressing well with value-add refurbishments totalling $40 million > Sold final offshore asset for €54.9 million and completed sale of 628 Bourke Street Melbourne at 14% premium to book value > Completed bank debt refinancing of $398 million > Maintain long weighted average debt duration of 5.4 years > Low weighted average cost of debt – 4.2%
6 May 2015 IOF Interim Results Presentation – Macquarie Australia Conference 2
Financial Portfolio Capital management
> Investa Property Group is ultimately owned by funds controlled by Morgan Stanley Real Estate Investing (Morgan Stanley) > Morgan Stanley have announced they are commencing a process to sell Investa Property Group (IPG):
management entity that provides asset and property management to over $8.9 billion of commercial
6 May 2015 IOF Interim Results Presentation – Macquarie Australia Conference 3
IOF AUM: A$3.1bn 23 assets ICPF AUM: A$2.9bn 15 assets
INVESTA OFFICE MANAGEMENT PLATFORM $9bn
Private Mandate AUM: A$0.5bn 3 assets IPT AUM: A$2.3bn 13 assets
INVESTA LAND $3bn end value
INVESTA PROPERTY GROUP
6 May 2015 IOF Interim Results Presentation – Macquarie Australia Conference 4
Deborah Page Peter Dodd Scott MacDonald Peter Rowe
INVESTA LISTED FUNDS MANAGEMENT LIMITED (ILFML) > An Independent Board Committee (IBC), comprised solely of the independent Directors and chaired by Deborah Page (IOF independent Chairman) has been established > The IBC had discussions with Morgan Stanley in relation to acquiring IOM:
the best interests of unitholders > IOF has the following rights:
> Pre-emptive rights will only be triggered in certain circumstances > Any related party transaction would require unitholder approval
Jonathan Callaghan
Independent Directors and IBC Members
Proactively adding value
> High quality assets with affordable accommodation <$900psm have outperformed, with strong leasing results achieved at:
> Improving levels of activity in Brisbane – with 11,400 sqm of leasing agreed including:
QR break over 4,900sqm – maintaining occupancy at 93% in FY16 > Completed lease-up of retail at 567 Collins Street – increasing the pre-commitment level to 78%
6 O’Connell Street, Sydney 239 George Street, Brisbane
6 May 2015 IOF Interim Results Presentation – Macquarie Australia Conference 6
> Valuations completed across 11 assets (60% portfolio by value), recording $12.6 million of net uplifts above prior book values > Uplifts of $58 million (+4.6%) in Sydney and Melbourne – driven by higher rents and cap rate compression > Valuation uplifts have been offset by declines totalling $45 million (-8.5%) in Brisbane and Perth, where challenging leasing markets have impacted carrying values
Material valuation movements
6 May 2015 IOF Interim Results Presentation – Macquarie Australia Conference 7
Valuation movement Key Driver/s Piccadilly Complex, Sydney $16m (+9%) Leased up all vacancy from acquisition 242 Exhibition Street, Melbourne $11m (+5%) Cap rate compression following transactional activity 126 Phillip Street, Sydney $9m (+4%) De-risked expiries and reduced vacancy to 3% 66 St Georges Terrace, Perth
Impacted by declining rents and increasing incentives 295 Ann Street, Brisbane
Break exercised by major tenant over 4 floors; lower rents and higher incentives adopted
> Net property income increased 12% to $95.8 million:
Piccadilly and 6 O’Connell Street > Like-for-like NPI growth impacted by vacancy at 140 Creek Street, Brisbane > Tenant retention remains high at 75% > Occupancy down on pcp – but flat on 30 June 2014 at 93% > Average incentive 19%:
6 May 2015 IOF Interim Results Presentation – Macquarie Australia Conference 8
Key Metrics 31 Dec 2014 31 Dec 2013 Net Property Income (NPI) $95.8m $85.4m Like-for-like NPI growth (2.6%) 0.4% Tenant retention (by income) 75% 82% Occupancy (by income) 93% 96% Weighted average lease expiry 4.9yrs 5.0yrs Face rent renewal growth 3.0% 1.6% Average passing face rent $581psm $551psm Number of investments 22 21
> Brisbane remains our major focus:
Street – creating high quality and affordable A-grade product – leased first floor, gaining momentum
reducing forecast vacancy from 8,500 sqm to 4,500 sqm
239 George Street – leased ahead of October 2015 expiry > All major vacancies and expiries re- leased in Sydney including Piccadilly and 99 Walker Street > Development at 151 Clarence Street - on schedule to begin construction 2H16
6 May 2015 IOF Interim Results Presentation – Macquarie Australia Conference 9
Property Location Tenant Area (sqm) Expiry Vacant 140 Creek St Brisbane 10,774 15 Adelaide St Brisbane 3,725 295 Ann St Brisbane 1,643 FY15 Piccadilly Sydney Various 1,994 Oct ‘14 10-20 Bond St Sydney Origin Energy 4,661 Nov ’14 99 Walker St North Sydney AAMI 4,602 Jan ‘15 295 Ann St Brisbane Queensland Rail 2,910 Jun ‘15 FY16 239 George St Brisbane DPW 2,619 Oct ‘15 126 Phillip St Sydney Deutsche 10,108 Oct ’15 151 Clarence St Sydney Westpac 7,483 Dec ’15 151 Clarence St Sydney Telstra 3,089 Feb ‘16 140 Creek St Brisbane DTMR / DPW 8,819 Jun ‘16 FY17 383 La Trobe St Melbourne AFP 9,679 Jun ‘17
Continued portfolio transformation
> Price discipline maintained whilst upgrading the portfolio and targeting assets with high risk-adjusted returns:
> Considerably increased exposure to our preferred market - Sydney:
flexible floorplates
tenant demand and rising rents > Sydney exposure to increase further through development of 151 Clarence Street
6 May 2015 IOF Interim Results Presentation – Macquarie Australia Conference 11 35% 35% 8% 17% 3% 2% 0% 59% 18% 15% 5% 3% 0% 10% 20% 30% 40% 50% 60% Offshore Sydney Melbourne Brisbane Perth ACT FY11 1H15
Portfolio transformation – increased exposure to Sydney
1
> Acquired in March 2014 at a 6.9% initial and 7.1% cap rate:
– a 9% upward valuation movement > Attracted by the location, flexible floor plate and affordable rents – and ability to add value through leasing:
the Tower – all the vacancy from acquisition
reversion > Former ICAC floors being refurbished and available from March 2015 – with lease enquiry encouraging > Partnership with Stockland generating strong results – with the retail now 100% leased or under offer
6 May 2015 IOF Interim Results Presentation – Macquarie Australia Conference 12
Reducing costs and risks
Key Indicators 31 Dec 2014 30 Jun 2014 Drawn debt $971m $1,019m Gearing (look-through) 30.7% 32.0% Weighted average debt cost 4.2% 4.7% Weighted average debt maturity 5.4yrs 5.8yrs Interest rate hedging 35% 35% Interest cover ratio (look- through) 4.6x 4.9x S & P credit rating BBB+ BBB+
Debt Maturity Profile ($m)
125 57 89 129 73 66 65 150 50 166 67 34 116 50 100 150 200 250 FY15 FY16 FY17 FY18 FY19 FY20 FY25 FY26 FY27 FY28 FY29 Undrawn Bank Debt Drawn Bank Debt USPP ($A) Bastion Tower MTN * Calculated on the 12 months to 31 December 2014
> Lower debt and gearing following sale of 628 Bourke Street, Melbourne > Long weighted average debt maturity of 5.4 years and low weighted average cost of debt of 4.2%:
> Bias towards floating rates (~35% hedged) will provide interest cost tailwind into FY16
6 May 2015 IOF Interim Results Presentation – Macquarie Australia Conference 14 5.1% 5.1% 5.2% 4.7% 4.2% 0.0% 1.0% 2.0% 3.0% 4.0% 5.0% 6.0% FY11 FY12 FY13 FY14 1H15*
Average Cost of Debt
> Sydney and Melbourne are reporting absorption well above long run averages, ahead of our leading indicator boosted by recentralisation:
> Stabilised demand in Brisbane following government and mining contraction cycle > Perth has been weaker than expected, albeit the rate of contraction is slowing
Annual absorption (% of Stock)
Source: JLL Research, ANZ, Westpac MI, MSCI, NAB, ASX, ISM and Investa Research (forecasts and model) 16 Brisbane Perth Melbourne Sydney
Investa Sydney and Melbourne CLI
6 May 2015 IOF Interim Results Presentation – Macquarie Australia Conference
50,000 100,000 150,000 200,000 250,000 1995 1997 1999 2001 2003 2005 2007 2009 2011 2013 2015
0% 1% 2% 3% 4% 5% 1992 1994 1996 1998 2000 2002 2004 2006 2008 2010 2012 2014 Sydney/Melbourne CBD CLI (12mth lead) LR average Sydney/Melbourne Absorption (% of stock, pa) leads by 12 months LR ave.
> Sydney vacancy likely to compress further – especially in B grade where vacancy could reduce to 5% > Supply threats in Melbourne to subdue rental growth > Withdrawals in Brisbane combined with broader demand from healthcare, education and property and business services will lessen the impact of new supply – especially in the government /mid-town precincts where vacancy is 9% > Perth vacancy likely to peak in 2015 at around 20%
CBD vacancy rates
Source: JLL Research and Investa Research 17 6 May 2015 IOF Interim Results Presentation – Macquarie Australia Conference 0% 2% 4% 6% 8% 10% 12% 14% 16% 18% 20% 1995 1997 1999 2001 2003 2005 2007 2009 2011 2013 2015 Sydney CBD Melbourne CBD Brisbane CBD Perth CBD North Sydney
Sydney CBD Net Absorption (rolling annual, sqm)
Source: JLL Research and Investa Research (forecasts) 6 May 2015 IOF Interim Results Presentation – Macquarie Australia Conference 18 000’s sqm
Sydney CBD 3 year net supply
000’s sqm Premium A Grade B Grade
> Small tenants – ~40% of the market – are underpinning recovery:
> We expect tenant relocations from fringe markets to continue > The impact from withdrawals has become more certain during the period – with the pipeline firming:
residential/hotel developers for alternative use
medium-term accommodation > Temporary withdrawals for 2 – 4 year refurbishments or redevelopments may reduce vacancy below 5%
Composition of absorption
Composition of net supply Net Inter-market Relocations (post-2009
150,000 340,000 340,000 87,000 80,000 7,000 160,000 34,000 (195,000)
100 200 300 400
3 yr gross supply Permanent withdrawals Withdrawal of 151 Clarence St, 60 Martin Place and 50 Bridge St along with Loftus & Young St Bldgs 3 year net supply 3 year net supply (by grade)
Withdrawals Premium supply
3 yr absorption (at current annual rate)
50 100 150 200 1999 2001 2003 2005 2007 2009 2011 2013 2015
Communicati
Other Consolidated Sectors Minor Tenant Moves (<1,000sqm) Property and Business Services Finance and Insurance Education
19
> Record low interest rates globally have intensified investor thirst for yield > RBA easing policy has placed continued downward pressure on bond yields > Current spreads between bonds and office cap rates are at record levels > We expect that this spread will narrow as office cap rates tighten further
* Source: RBA, IPD and Investa Research
10 year Government Bonds and Office Discount Rates and Cap Rates
6 May 2015 IOF Interim Results Presentation – Macquarie Australia Conference 2% 3% 4% 5% 6% 7% 8% 9% 10% 11% 12% 1998 2000 2002 2004 2006 2008 2010 2012 2014 10 Year Govt Bond Yield Office Cap Rate Office Discount Rate
6 May 2015 IOF Interim Results Presentation – Macquarie Australia Conference 21
Ongoing pro-active management > Dedicated focus on leasing continues to de-risk
> Actively pursuing opportunities to acquire and recycle assets > Asset values to continue to rise in Sydney and Melbourne with improved leasing conditions and strong capital flows > Intensive management continuing in Brisbane and Perth to preserve value in challenging markets > Long dated cash flows on passive assets to remain highly sought-after by investors Market conditions > Guidance upgraded from 27.3 cpu to 27.5 cpu FFO (3.8% growth on FY14) > Distribution upgraded in line with FFO – increasing from 19.1 cpu to 19.25 cpu (70% of FFO) > Subject to prevailing market conditions Outlook
1% 7% 5% 7% 0% 2% 4% 6% 8% 10% 12% 14% FY15 FY16 FY17 FY18
Lease expiries at risk (% total income)
4% 151 Clarence St
Should you have any questions regarding the Fund, please call Investor Relations on +61 300 130 231 or email: investorrelations@investa.com.au If you have any questions about your unitholding, distribution statements or any change of details, please call the unitholder information line on +61 300 851 394. More information about the Fund can be accessed and downloaded at investa.com.au/IOF Investa Listed Funds Management Limited Level 6, Deutsche Bank Place 126 Phillip Street Sydney NSW 2000 Australia Phone: +61 2 8226 9300 Fax: +61 2 9844 9300 ACN 149 175 655 AFSL 401414 Ming Long IOF Fund Manager Phone: +61 2 8226 9324 Mobile: 0400 686 090 Email: mlong@investa.com.au Alex Abell Assistant Fund Manager Phone: +61 2 8226 9341 Mobile: 0466 775 112 Email: aabell@investa.com.au
This presentation was prepared by Investa Listed Funds Management Limited (ACN 149 175 655 and AFSL 401414) on behalf of the Investa Office Fund, which comprises the Prime Credit Property Trust (ARSN 089 849 196) and the Armstrong Jones Office Fund (ARSN 090 242 229). Information contained in this presentation is current as at 19 February 2015 unless otherwise stated. This presentation is provided for general information purposes only and has been prepared without taking account of any particular readers financial situation, objectives or needs. Nothing contained in this presentation constitutes investment, legal, tax or other advice. Accordingly, readers should conduct their own due diligence in relation to any information contained in this presentation and, before acting on any information in this presentation, consider its appropriateness, having regard to their objectives, financial situation and needs, and seek the assistance of their financial or other licensed professional adviser before making any investment decision. This presentation does not constitute an offer, invitation, solicitation or recommendation with respect to the subscription for, purchase or sale of any security, nor does it form the basis of any contract or commitment. Except as required by law, no representation or warranty, express or implied, is made as to the fairness, accuracy or completeness of the information,
looking statements, which are not guarantees or predictions of future performance. Any forward-looking statements contained in this presentation involve known and unknown risks and uncertainties which may cause actual results to differ from those contained in this presentation. By reading this presentation and to the extent permitted by law, the reader releases Investa Property Group and its affiliates, and any of their respective directors,
damage arising by negligence) arising in relation to any reader relying on anything contained in or omitted from this presentation.