Introduction to I/O and File storage. Disk Management dollar/GB - - PDF document

introduction to i o and
SMART_READER_LITE
LIVE PREVIEW

Introduction to I/O and File storage. Disk Management dollar/GB - - PDF document

Secondary Storage Management Disks just like memory, only different Why have disks? Memory is small. Disks are large. Short term storage for memory contents (e.g., swap space). Reduce what must be kept in memory (e.g., code


slide-1
SLIDE 1 1

Introduction to I/O and Disk Management

2

Secondary Storage Management

Disks — just like memory, only different
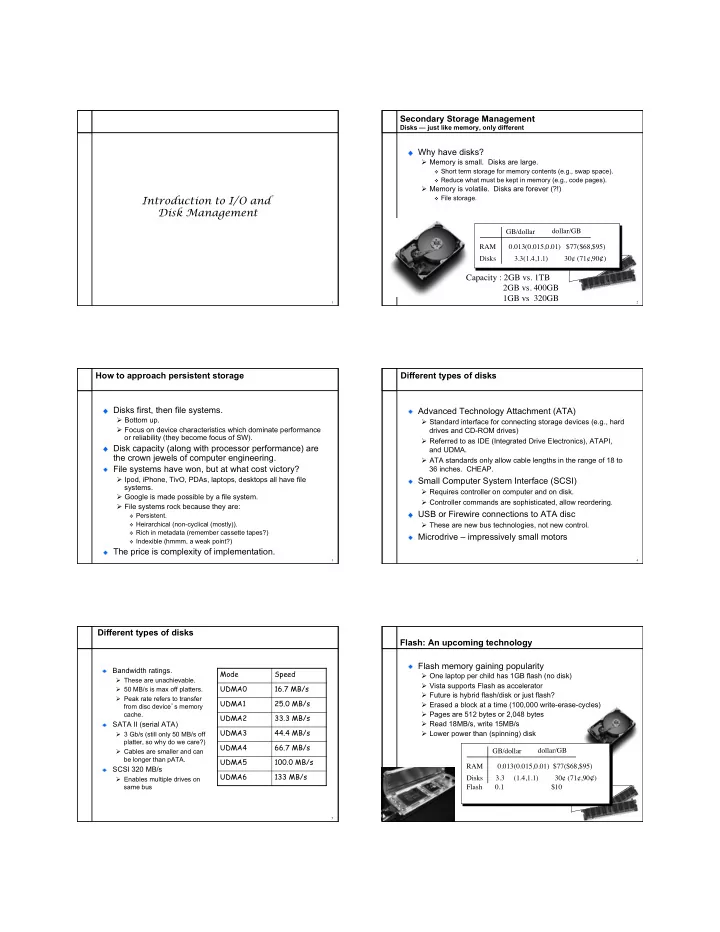
Why have disks?

Ø Memory is small. Disks are large.

❖ Short term storage for memory contents (e.g., swap space). ❖ Reduce what must be kept in memory (e.g., code pages).

Ø Memory is volatile. Disks are forever (?!)

❖ File storage.

GB/dollar dollar/GB RAM 0.013(0.015,0.01) $77($68,$95) Disks 3.3(1.4,1.1) 30¢ (71¢,90¢)

Capacity : 2GB vs. 1TB 2GB vs. 400GB 1GB vs 320GB

3

How to approach persistent storage Disks first, then file systems.

Ø Bottom up. Ø Focus on device characteristics which dominate performance

  • r reliability (they become focus of SW).

Disk capacity (along with processor performance) are the crown jewels of computer engineering. File systems have won, but at what cost victory?

Ø Ipod, iPhone, TivO, PDAs, laptops, desktops all have file systems. Ø Google is made possible by a file system. Ø File systems rock because they are:

❖ Persistent. ❖ Heirarchical (non-cyclical (mostly)). ❖ Rich in metadata (remember cassette tapes?) ❖ Indexible (hmmm, a weak point?)

The price is complexity of implementation.

4

Different types of disks Advanced Technology Attachment (ATA)

Ø Standard interface for connecting storage devices (e.g., hard drives and CD-ROM drives) Ø Referred to as IDE (Integrated Drive Electronics), ATAPI, and UDMA. Ø ATA standards only allow cable lengths in the range of 18 to 36 inches. CHEAP.

Small Computer System Interface (SCSI)

Ø Requires controller on computer and on disk. Ø Controller commands are sophisticated, allow reordering.

USB or Firewire connections to ATA disc

Ø These are new bus technologies, not new control.

Microdrive – impressively small motors

5

Different types of disks

Bandwidth ratings.

Ø These are unachievable. Ø 50 MB/s is max off platters. Ø Peak rate refers to transfer from disc device’s memory cache.

SATA II (serial ATA)

Ø 3 Gb/s (still only 50 MB/s off platter, so why do we care?) Ø Cables are smaller and can be longer than pATA.

SCSI 320 MB/s

Ø Enables multiple drives on same bus

Mode Speed UDMA0 16.7 MB/s UDMA1 25.0 MB/s UDMA2 33.3 MB/s UDMA3 44.4 MB/s UDMA4 66.7 MB/s UDMA5 100.0 MB/s UDMA6 133 MB/s

6

Flash: An upcoming technology Flash memory gaining popularity

Ø One laptop per child has 1GB flash (no disk) Ø Vista supports Flash as accelerator Ø Future is hybrid flash/disk or just flash? Ø Erased a block at a time (100,000 write-erase-cycles) Ø Pages are 512 bytes or 2,048 bytes Ø Read 18MB/s, write 15MB/s Ø Lower power than (spinning) disk GB/dollar dollar/GB RAM 0.013(0.015,0.01) $77($68,$95) Disks 3.3 (1.4,1.1) 30¢ (71¢,90¢) Flash 0.1 $10

slide-2
SLIDE 2 7

Anatomy of a Disk

Basic components

1 2 s–1 . . . Block/Sector Track Cylinder Platter Surface Head Spindle

8

Disk structure: the big picture Physical structure of disks

9

Anatomy of a Disk

Seagate 73.4 GB Fibre Channel Ultra 160 SCSI disk

Specs: Ø 12 Platters Ø 24 Heads Ø Variable # of sectors/track Ø 10,000 RPM

❖ Average latency: 2.99 ms

Ø Seek times

❖ Track-to-track: 0.6/0.9 ms ❖ Average: 5.6/6.2 ms ❖ Includes acceleration and

settle time.

Ø 160-200 MB/s peak transfer rate

❖ 1-8K cache

Ø 12 Arms Ø 14,100 Tracks Ø 512 bytes/sector

10

Anatomy of a Disk

Example: Seagate Cheetah ST373405LC (March 2002) Specs: Ø Capacity: 73GB Ø 8 surfaces per pack Ø # cylinders: 29,549 Ø Total number of tracks per system: 236,394 Ø Variable # of sectors/track (776 sectors/track (avg)) Ø 10,000 RPM

❖ average latency: 2.9 ms.

Ø Seek times

❖ track-to-track: 0.4 ms ❖ Average/max: 5.1 ms/9.4ms

Ø 50-85 MB/s peak transfer rate

❖ 4MB cache

Ø MTBF: 1,200,000 hours

11

Disk Operations

Read/Write operations

Present disk with a sector address

Ø Old: DA = (drive, surface, track, sector) Ø New: Logical block address (LBA)

Heads moved to appropriate track

Ø seek time Ø settle time

The appropriate head is enabled Wait for the sector to appear under the head

Ø “rotational latency”

Read/write the sector

Ø “transfer time”

Read time: seek time + latency + transfer time (5.6 ms + 2.99 ms + 0.014 ms)

12

Disk access latency Which component of disk access time is the longest?

Ø A. Rotational latency Ø B. Transfer latency Ø C. Seek latency

slide-3
SLIDE 3 13

Disk Addressing Software wants a simple “disc virtual address space” consisting of a linear array of sectors.

Ø Sectors numbered 1..N, each 512 bytes (typical size). Ø Writing 8 surfaces at a time writes a 4KB page.

Hardware has structure:

Ø Which platter? Ø Which track within the platter? Ø Which sector within the track?

The hardware structure affects latency.

Ø Reading from sectors in the same track is fast. Ø Reading from the same cylinder group is faster than seeking.

14

Disk Addressing

Mapping a 3-D structure to a 1-D structure

Mapping criteria

Ø block n+1 should be as “close” as possible to block n

Track Sector Surface n

2p–1 2 t–1 ... 1 0

1 s–1 . . .

...

?

File blocks

15

Transfer Time

The Impact of File Mappings

File access times: Contiguous allocation

Array elements map to contiguous sectors on disk

Ø Case1: Elements map to the middle of the disk Seek Time Lat- ency

5.6 + 3.0 + 6.0

Constant Terms Variable Term

2,048 424 = 8.6 + 29.0 = 37.6 ms

× =

time per revolution number of revolutions required to transfer data Transfer Time

16

The Impact of File Mappings

File access times: Contiguous allocation

Array elements map to contiguous sectors on disk

Ø Case1: Elements map to the middle tracks of the platter

5.6 + 3.0 + 6.0

2,048 212

5.6 + 3.0 + 6.0

2,048 636 Case2: Elements map to the inner tracks of the platter Case3: Elements map to the outer tracks of the platter

= 8.6 + 58.0 = 66.6 ms = 8.6 + 19.3 = 27.9 ms 5.6 + 3.0 + 6.0

2,048

= 8.6 + 29.0 = 37.6 ms

424

17

Disk Addressing

The impact of file mappings: Non-contiguous allocation

Array elements map to random sectors on disk

Ø Each sector access results in a disk seek

2,048 × (5.6 + 3.0) = 17.6 seconds

n

File blocks 2p–1 2 t–1 ... 1 0

1 s–1 . . .

...

18

Practical Knowledge If the video you are playing off your hard drive skips, defragment your file system. OS block allocation policy is complicated. Defragmentation allows the OS to revisit layout with global information. Unix file systems need defragmentation less than Windows file systems, because they have better allocation policies.

slide-4
SLIDE 4 19

Defragmentation Decisions Files written when the disk is nearly full are more likely to be fragmented.

Ø A. True Ø B. False

20

In a multiprogramming/timesharing environment, a queue

  • f disk I/O requests can form

Disk Head Scheduling

Maximizing disk throughput CPU Disk Other I/O

The OS maximizes disk I/O throughput by minimizing head movement through disk head scheduling (surface, track, sector)

21

Disk Head Scheduling

Examples

Assume a queue of requests exists to read/write tracks:

Ø and the head is on track 65

150 125 100 75 50 25

150 16 147 14 72 83

65

22

Assume a queue of requests exists to read/write tracks:

Ø and the head is on track 65

Disk Head Scheduling

Examples

150 125 100 75 50 25

150 16 147 14 72 83

65 FCFS scheduling results in the head moving 550 tracks Can we do better?

23

Greedy scheduling: shortest seek time first

Ø Rearrange queue from: To:

Disk Head Scheduling

Minimizing head movement

150 125 100 75 50 25

150 16 147 14 72 83 72 82 147 150 16 14

24

Disk Head Scheduling

Minimizing head movement

Greedy scheduling: shortest seek time first

Ø Rearrange queue from: To: 150 125 100 75 50 25

150 16 147 14 72 83 72 82 147 150 16 14

SSTF scheduling results in the head moving 221 tracks Can we do better?

slide-5
SLIDE 5 25

16 14 72 83 147 150 Rearrange queue from: To: Disk Head Scheduling

SCAN scheduling

150 125 100 75 50 25

150 16 147 14 72 83 16 14 72 83 147

“SCAN” scheduling: Move the head in one direction until all requests have been serviced and then reverse. Also called elevator scheduling. Moves the head 187 tracks

150

26

Disk Head Scheduling

Other variations

C-SCAN scheduling (“Circular”-SCAN)

Ø Move the head in one direction until an edge of the disk is reached and then reset to the opposite edge

150 125 100 75 50 25

LOOK scheduling Same as C-SCAN except the head is reset when no more requests exist between the current head position and the approaching edge of the disk

27

Disk Performance

Disk partitioning

Disks are typically partitioned to minimize the largest possible seek time

Ø A partition is a collection of cylinders Ø Each partition is a logically separate disk Partition A Partition B

28

Disks – Technology Trends

Disks are getting smaller in size

Ø Smaller à spin faster; smaller distance for head to travel; and lighter weight

Disks are getting denser

Ø More bits/square inch à small disks with large capacities

Disks are getting cheaper

Ø 2x/year since 1991

Disks are getting faster

Ø Seek time, rotation latency: 5-10%/year (2-3x per decade) Ø Bandwidth: 20-30%/year (~10x per decade)

Overall:

Ø Disk capacities are improving much faster than performance

29

Management of Multiple Disks

Using multiple disks to increase disk throughput

Disk striping (RAID-0)

Ø Blocks broken into sub-blocks that are stored on separate disks

❖ similar to memory interleaving

Ø Provides for higher disk bandwidth through a larger effective block size 3 8 9 10 11 12 13 14 15 0 1 2 3

OS disk block

8 9 10 11

Physical disk blocks

2 1 12 13 14 15 0 1 2 3

30

0 1 1 0 0 1 1 1 0 1 0 1 0 1 1

Management of Multiple Disks

Using multiple disks to improve reliability & availability

To increase the reliability of the disk, redundancy must be introduced

Ø Simple scheme: disk mirroring (RAID-1) Ø Write to both disks, read from either.

x x

0 1 1 0 0 1 1 1 0 1 0 1 0 1 1

Primary disk Mirror disk

slide-6
SLIDE 6 31

Who controls the RAID? Hardware

Ø +Tend to be reliable (hardware implementers test) Ø +Offload parity computation from CPU

❖ Hardware is a bit faster for rewrite intensive workloads

Ø -Dependent on card for recovery (replacements?) Ø -Must buy card (for the PCI bus) Ø -Serial reconstruction of lost disk

Software

Ø -Software has bugs Ø -Ties up CPU to compute parity Ø +Other OS instances might be able to recover Ø +No additional cost Ø +Parallel reconstruction of lost disk

32

3 2 1

Management of Multiple Disks

Using multiple disks to increase disk throughput

RAID (redundant array of inexpensive disks) disks

Ø Byte-wise striping of the disks (RAID-3) or block-wise striping of the disks (RAID-0/4/5) Ø Provides better performance and reliability

Example: storing the byte-string 101 in a RAID-3 system 1 x x x x x x x x x x x x x x 0 x x x x x x x x x x x x x x 1 x x x x x x x x x x x x x x

33

Improving Reliability and Availability

RAID-4

Block interleaved parity striping

Ø Allows one to recover from the crash of any one disk Ø Example: storing 8, 9, 10, 11, 12, 13, 14, 15, 0, 1, 2, 3

RAID-4 layout:

Disk 1 Disk 2 Disk 3 Parity Disk 1 1 1 1 1 1 1 1 0 0 0 0 0 0 0 0 1 1 1 1 0 0 0 0 0 0 1 1 0 0 1 1 0 0 1 1 1 1 0 0 0 0 1 1 0 0 1 1

x x x x

34

x

Improving Reliability and Availability

RAID-5 Block interleaved parity striping

Disk 1 Disk 2 Disk 3 Disk 4 Disk 5

1 1 1 1 1 1 1 1 0 0 0 0 0 0 0 0 1 1 1 1 0 0 0 0 0 0 1 1 0 0 1 1 0 0 1 1 0 1 0 1 0 1 0 1 0 1 0 1 1 0 0 1 0 1 1 0 0 1 1 0

8 9 10 11 12 13 14 15 1 2 3 Block x Parity Block x

x x x x

35

Improving Reliability and Availability

RAID-5 Block interleaved parity striping

Disk 1

x x

Disk 2 Disk 3

x

Disk 4 Disk 5

1 1 1 1 1 1 1 1 0 0 0 0 0 0 0 0 1 1 1 1 0 0 0 0 0 0 1 1 0 0 1 1 0 0 1 1 0 1 0 1 0 1 0 1 0 1 0 1 1 0 0 1 0 1 1 0 0 1 1 0 1 1 1 1 1 1 1 1 0 0 0 0 0 0 0 0 1 1 1 1 0 0 0 0 0 0 1 1 0 0 1 1 0 0 1 1 0 1 0 1 0 1 0 1 0 1 0 1 1 0 0 1 0 1 1 0 0 1 1 0 1 1 1 1 1 1 1 1 0 0 0 0 0 0 0 0 1 1 1 1 0 0 0 0 0 0 1 1 0 0 1 1 0 0 1 1 0 1 0 1 0 1 0 1 0 1 0 1 1 0 0 1 0 1 1 0 0 1 1 0 1 1 1 1 1 1 1 1 0 0 0 0 0 0 0 0 1 1 1 1 0 0 0 0 0 0 1 1 0 0 1 1 0 0 1 1 0 1 0 1 0 1 0 1 0 1 0 1 1 0 0 1 0 1 1 0 0 1 1 0

8 9 10 11 12 13 14 15 1 2 3 Block x Parity Block x+1 Parity a b c d e f g h i j k l m n

  • Block

x+2 Parity p q r s t u v w x y z aa bb cc dd Block x+3 Parity ee ff gg hh ii jj Block x Block x+1 Block x+2 Block x+3

x x