introduction the plague the scaling laws of human travel
play

Introduction: the plague The Scaling Laws Of Human Travel highly - PDF document

How to asses human travel? How to asses human travel? The theory of stochastic processes The theory of stochastic processes Application Application Summary Summary Sources Sources Introduction: the plague The Scaling Laws Of Human Travel


  1. How to asses human travel? How to asses human travel? The theory of stochastic processes The theory of stochastic processes Application Application Summary Summary Sources Sources Introduction: the plague The Scaling Laws Of Human Travel ◮ highly infectious disease ◮ several pandemics have influenced the human history Verena Zuber ◮ the severest pandemic has taken place in the 14th century Department of Statistics ◮ about one third of the whole population died University of Munich ◮ the beginning goes back to the 30ies in central Asia 7. July 2006 ◮ 1347 it was first observed on the European continent near the Krim (at the Black Sea) ◮ 1348 it reached south Europe ◮ 1349 it had spread almost all over Europe Verena Zuber The Scaling Laws Of Human Travel 1/45 Verena Zuber The Scaling Laws Of Human Travel 2/45 How to asses human travel? How to asses human travel? The theory of stochastic processes The theory of stochastic processes Application Application Summary Summary Sources Sources 
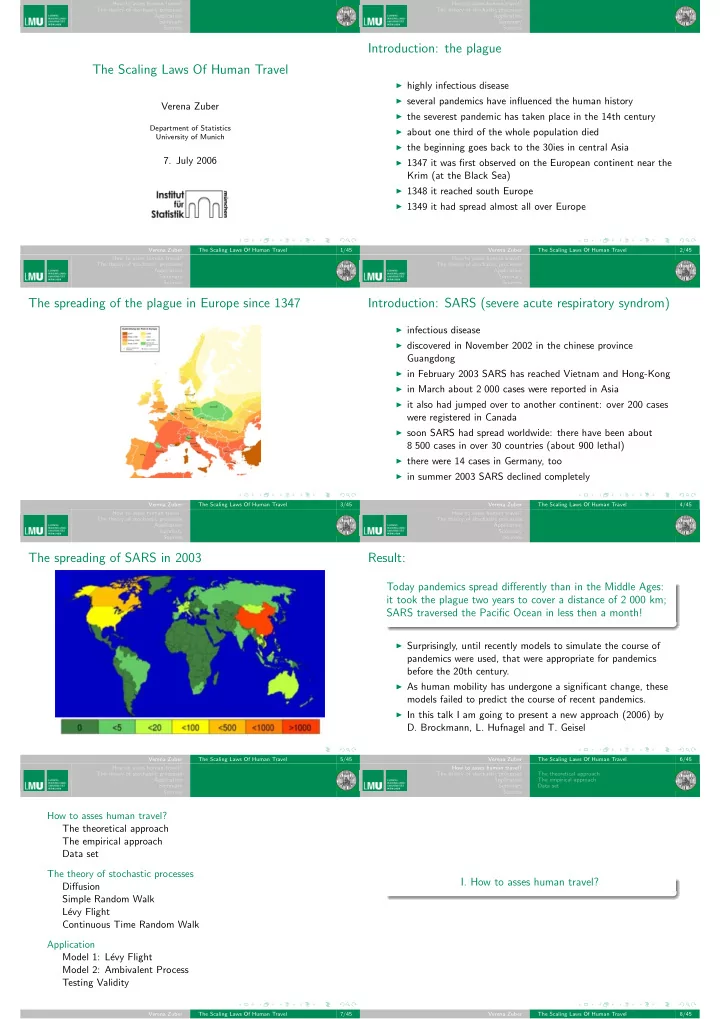
The spreading of the plague in Europe since 1347 Introduction: SARS (severe acute respiratory syndrom) ◮ infectious disease ◮ discovered in November 2002 in the chinese province Guangdong ◮ in February 2003 SARS has reached Vietnam and Hong-Kong ◮ in March about 2 000 cases were reported in Asia ◮ it also had jumped over to another continent: over 200 cases were registered in Canada ◮ soon SARS had spread worldwide: there have been about 8 500 cases in over 30 countries (about 900 lethal) ◮ there were 14 cases in Germany, too ◮ in summer 2003 SARS declined completely Verena Zuber The Scaling Laws Of Human Travel 3/45 Verena Zuber The Scaling Laws Of Human Travel 4/45 How to asses human travel? How to asses human travel? The theory of stochastic processes The theory of stochastic processes Application Application Summary Summary Sources Sources The spreading of SARS in 2003 Result: Today pandemics spread differently than in the Middle Ages: it took the plague two years to cover a distance of 2 000 km; SARS traversed the Pacific Ocean in less then a month! ◮ Surprisingly, until recently models to simulate the course of pandemics were used, that were appropriate for pandemics before the 20th century. ◮ As human mobility has undergone a significant change, these models failed to predict the course of recent pandemics. ◮ In this talk I am going to present a new approach (2006) by D. Brockmann, L. Hufnagel and T. Geisel Verena Zuber The Scaling Laws Of Human Travel 5/45 Verena Zuber The Scaling Laws Of Human Travel 6/45 How to asses human travel? How to asses human travel? The theory of stochastic processes The theory of stochastic processes The theoretical approach Application Application The empirical approach Summary Summary Data set Sources Sources How to asses human travel? The theoretical approach The empirical approach Data set The theory of stochastic processes I. How to asses human travel? Diffusion Simple Random Walk L´ evy Flight Continuous Time Random Walk Application Model 1: L´ evy Flight Model 2: Ambivalent Process Testing Validity Verena Zuber The Scaling Laws Of Human Travel 7/45 Verena Zuber The Scaling Laws Of Human Travel 8/45

  2. How to asses human travel? How to asses human travel? The theory of stochastic processes The theoretical approach The theory of stochastic processes The theoretical approach Application The empirical approach Application The empirical approach Summary Data set Summary Data set Sources Sources How to asses human travel? The theoretical approach Home range: No appropriate data exists to describe human travel: Geographical patch in which a person resides most of the time. thus the relationship between human travel and the movement of People interact and consequently either share home ranges or banknotes was analysed. entrance other peoples’ home ranges. Thus an individuum infects The banknote data is from the online bill-tracking website: others with a desease. At the moment over 85 million bills are registered. This data includes 464 670 dollar bills with 1 033 095 reports. From these data we can obtain the distance traveled and the time elapsed. Verena Zuber The Scaling Laws Of Human Travel 9/45 Verena Zuber The Scaling Laws Of Human Travel 10/45 How to asses human travel? How to asses human travel? The theory of stochastic processes The theoretical approach The theory of stochastic processes The theoretical approach Application The empirical approach Application The empirical approach Summary Data set Summary Data set Sources Sources 1.) US Bureau of Transportation Statistics Data 2.) US aviation network data There are over 2.5 million round trip distances recorded, but the spatial resolution is low and no data exists for the time the movement has taken. A frequency distribution comparing the distance traveled: The passenger flux on the US aviation network as well as the movement of bills between different states can be represented as a matrix W or M , respectively, where: ◮ W m , n : number of passengers travelling from state m to n ◮ M m , n : number of banknotes travelling from state m to n Verena Zuber The Scaling Laws Of Human Travel 11/45 Verena Zuber The Scaling Laws Of Human Travel 12/45 How to asses human travel? How to asses human travel? The theory of stochastic processes The theoretical approach The theory of stochastic processes The theoretical approach Application The empirical approach Application The empirical approach Summary Data set Summary Data set Sources Sources 2.) Results: Data set Scatter plots for Georgia, Pennsylvania, Texas and Michigan: The data are based on the online bill-tracking system: www.wheresgeorge.com At the moment more then 6% of the total U.S. Currency in circulation is registered. This data set includes 464 670 dollar bills with 1 033 095 reports. The degree of correlation can be estimated by the correlation coefficient R for matrices: � W m , n M m , n � − � W m , n �� M m , n � R = � ( � W 2 m , n �� W m , n � ) 2 ( � M 2 m , n �� M m , n � ) 2 ◮ the single correlation for almost all states is significantly positive ◮ overall correlation coefficient is approximatly 0.5 Verena Zuber The Scaling Laws Of Human Travel 13/45 Verena Zuber The Scaling Laws Of Human Travel 14/45 How to asses human travel? How to asses human travel? Diffusion The theory of stochastic processes The theoretical approach The theory of stochastic processes Simple Random Walk Application The empirical approach Application L´ evy Flight Summary Data set Summary Continuous Time Random Walk Sources Sources Data set Variables: ◮ geographical displacement : | x 2 − x 1 | x 1 first and x 2 secondary report of a banknote; boundarys: ◮ short range radius (10km) II. The theory of stochastic processes ◮ approximate average East-West extension of the US ( ≈ 3 200km) ◮ elapsed time T between first and secondary report ◮ population size of the initial entry location: ◮ highly populated metropolitan areas ( N loc ≥ 120 000; about 35 . 7% of the entire population) ◮ cities of intermediate size (120 000 ≥ N loc ≥ 22 000; about 29 . 1% of the entire population) ◮ small towns ( N loc ≤ 22 000; about 25 . 2% of the entire population) Verena Zuber The Scaling Laws Of Human Travel 15/45 Verena Zuber The Scaling Laws Of Human Travel 16/45

Download Presentation
Download Policy: The content available on the website is offered to you 'AS IS' for your personal information and use only. It cannot be commercialized, licensed, or distributed on other websites without prior consent from the author. To download a presentation, simply click this link. If you encounter any difficulties during the download process, it's possible that the publisher has removed the file from their server.

Recommend


More recommend