Introduction Data explosion problem to Automated data - - PowerPoint PPT Presentation

introduction
SMART_READER_LITE
LIVE PREVIEW

Introduction Data explosion problem to Automated data - - PowerPoint PPT Presentation

Motivation: Necessity is the Mother of M ti ti N it i th M th f Invention Introduction Data explosion problem to Automated data collection tools and mature database technology lead to tremendous amounts of data


slide-1
SLIDE 1

Introduction to Data Mining

M ti ti “N it i th M th f Motivation: “Necessity is the Mother of Invention”

  • Data explosion problem
  • Automated data collection tools and mature database technology

lead to tremendous amounts of data stored in databases, data h d h i f i i i warehouses and other information repositories

Th i d i i h f d d d

  • There is a tremendous increase in the amount of data recorded

and stored on digital media

  • We are producing over two exabites (1018) of data per year
  • Storage capacity, for a fixed price, appears to be doubling

approximately every 9 months

2

approximately every 9 months

Motivation: “Necessity is the Mother of Motivation: Necessity is the Mother of Invention”

  • We are drowning in data, but starving for knowledge!

g g g

  • “The greatest problem of today is how to teach people to ignore the

irrelevant, how to refuse to know things, before they are suffocated. y For too many facts are as bad as none at all.” (W.H. Auden)

  • Solution: Data warehousing and data mining

Data warehousing and On Line Analytical Processing (OLAP)

  • Data warehousing and On-Line Analytical Processing (OLAP)
  • Extraction of interesting knowledge (rules, regularities, patterns,

constraints) from data in large databases

3

constra nts) from data n large databases

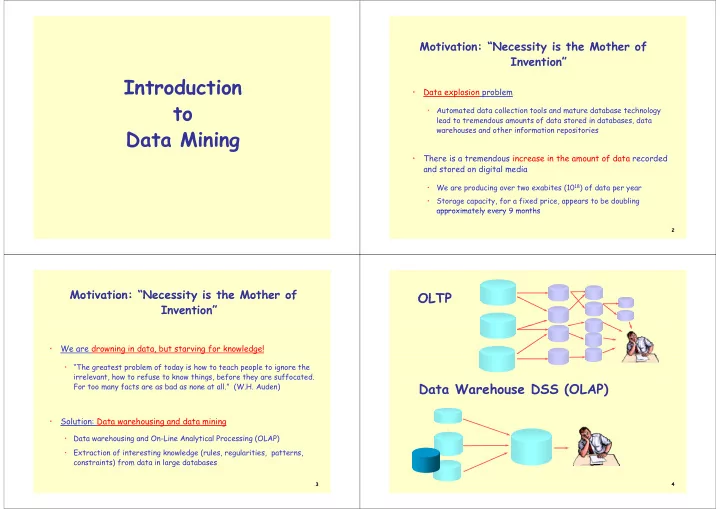
OLTP OLTP Data Warehouse DSS (OLAP)

4

slide-2
SLIDE 2

Big Data Examples Big Data Examples

  • Europe's Very Long Baseline Interferometry (VLBI) has 16 telescopes,

p y g y ( ) p , each of which produces 1 Gigabit/second of astronomical data over a 25-day observation session

d l i bi bl

  • storage and analysis a big problem
  • AT&T handles billions of calls per day

AT&T handles billions of calls per day

  • so much data, it cannot be all stored -- analysis has to be done “on the fly”,
  • n streaming data
  • Web
  • Alexa internet archive: 7 years of data, 500 TB
  • Google searches 4+ Billion pages, many hundreds TB
  • IBM WebFountain, 160 TB (2003)
  • Internet Archive (www archive org) ~ 300 TB

5

Internet Archive (www.archive.org), 300 TB

Data Growth Rate Estimates Data Growth Rate Estimates

  • Data stored in world’s databases doubles every 20 months

O h h i hi h

  • Other growth rate estimates even higher
  • Very little data will ever be looked at by a human

y y

  • Knowledge Discovery is NEEDED to make sense and use of data.

6

“Every time the amount of data increases by a factor of ten, we should totally rethink the way we analyze it” way we analyze it

Jerome Friedman, Data Mining and Statistics: What’s the Connection (paper 1997) g p p 7

Data Mining Data Mining

  • Data Mining query differs from Database query

Data Mining query differs from Database query

  • Query not well formulated

D t i m s s

  • Data in many sources
  • Discover actionable patterns & rules

T diti l A l sis

  • Traditional Analysis
  • Did sales of product X increase in Nov.?
  • Do sales of product X decrease when there is a promotion on

product Y?

D t i i i lt i t d

  • Data mining is result oriented
  • What are the factors that determine sales of product X?

8

slide-3
SLIDE 3

Data Mining Data Mining

  • Traditional analysis is incremental
  • Does billing level affect turnover?
  • Does billing level affect turnover?
  • Does location affect turnover?

A l t b ild d l t b t

  • Analyst builds model step by step
  • Data Mining is result oriented
  • Identify the factors and predict turnover

9

“The key in business is to know something that nobody else knows.” — Aristotle Onassis

PHOTO: LUCINDA DOUG PHOTO: HULTON-DEUTSCH COLL GLAS-MENZIES

“To understand is to perceive patterns.”

10

— Sir Isaiah Berlin

An Application Example An Application Example

  • A person buys a book (product) at Amazon.com

T k R d th b k ( d t ) thi

  • Task: Recommend other books (products) this person

is likely to buy

  • Amazon does clustering based on books bought:
  • customers who bought “Advances in Knowledge Discovery

and Data Mining”, also bought “Data Mining: Practical Machine Learning Tools and Techniques with Java Machine Learning Tools and Techniques with Java Implementations”

  • Recommendation program is quite successful

11

  • Recommendation program is quite successful

12

slide-4
SLIDE 4

Google news example G g n w amp

13

Another Application Example Another Application Example

  • Netflix prize
  • http://www.netflixprize.com/

http //www.n tf pr z .c m/

  • The Netflix Prize seeks to substantially improve the accuracy of

predictions about how much someone is going to love a movie predictions about how much someone is going to love a movie based on their movie preferences. Improve it enough and you win

  • ne (or more) Prizes. Winning the Netflix Prize improves our

ability to connect people to the movies they love ability to connect people to the movies they love.

  • We provide you with a lot of anonymous rating data, and a

prediction accuracy bar that is 10% better than what Cinematch prediction accuracy bar that is 10% better than what Cinematch can do on the same training data set.

illi d ll

14

  • You can win could have won one million dollars

Netflix Netflix

15

Netflix - Some Details

  • Dataset with 100 million date stamped movie ratings performed by

anonymous Netflix customers (Dec 1999 and Dec 2005), about 480,189 users and 7,770 movies.

  • A Hold-out set of about 4.2 million ratings was created consisting of

the last nine movies rated by each user. The remaining data made up the training set.

  • The Hold-out set was randomly split three ways, into subsets called

Probe, Quiz, and Test. The labels were attached to the Probe. The Quiz and Test sets made up an evaluation set, which is known as the p , Qualifying set, that competitors were required to predict ratings for. Once a competitor submits predictions, the prizemaster returns the error achieved on the Quiz set on a public leaderboard. error achieved on the Quiz set on a public leaderboard.

  • The winner of the prize is the one that scores best on the Test set, and

those scores were never disclosed by Netflix.

16

those scores were never disclosed by Netflix.

slide-5
SLIDE 5

Netflix Lessons Netflix - Lessons...

  • The biggest lesson learned, according to members of the two top

teams, was the power of collaboration. It was not a single insight, algorithm or concept that allowed both teams to surpass the goal algorithm or concept that allowed both teams to surpass the goal Netflix. Instead they say the formula for success was to bring together

  • Instead, they say, the formula for success was to bring together

people with complementary skills and combine different methods of problem-solving. p g

  • When BellKor’s announced that it had passed the 10 percent

threshold it set off a 30-day race under contest rules for other threshold, it set off a 30 day race, under contest rules, for other teams to try to best it. That led to another round of team-merging by BellKor’s leading rivals, who assembled a global consortium of b 30 b i l ll d h E bl

17

about 30 members, appropriately called the Ensemble.

Problems Suitable for Data Mining Problems Suitable for Data-Mining

  • The business problem is unstructured
  • The business problem is unstructured
  • Accurate prediction is more important than the explanation

H v cc ssibl suffici nt nd r l v nt d t

  • Have accessible, sufficient, and relevant data
  • The data are highly heterogeneous with a large percentage of
  • utliers leverage points and missing values
  • utliers, leverage points, and missing values
  • Require knowledge-based decisions
  • Have a changing environment
  • Have a changing environment
  • Have sub-optimal current methods

P id hi h ff f th i ht d i i !

  • Provides high payoff for the right decisions!

18

  • Privacy considerations important if personal data is involved

Wh t i D t Mi i ? What is Data Mining?

K l d Di i D t b

  • Knowledge Discovery in Databases
  • Is the non-trivial process of identifying
  • implicit (by contrast to explicit)
  • valid (patterns should be valid on new data)

novel (

lt b d b i t t d l )

  • novel (novelty can be measured by comparing to expected values)
  • potentially useful (should lead to useful actions)
  • understandable (to humans)

understandable (to humans)

  • patterns in data
  • Data Mining
  • Is a step in the KDD process

19

Is a step in the KDD process

What Is Data Mining?

  • Alternative names:
  • Data Mining: a misnomer?

Data Mining a misnomer? (knowledge mining from data?)

  • Knowledge discovery (mining) in databases (KDD),
  • knowledge extraction,
  • data/pattern analysis,
  • data archeology,
  • data dredging
  • data dredging,
  • information harvesting,
  • business intelligence, etc.

20

slide-6
SLIDE 6

KDD P KDD Process

Data Mining and the

K l d

Data Mining and the Knowledge Discovery P

Evaluation and Presentation

Knowledge

Process

S l ti d

Data Mining

Selection and Transformation Cleaning and Integration

DW

22

DB

Steps of a KDD Process p

  • Data cleaning: missing values, noisy data, and inconsistent data
  • Data integration: merging data from multiple data stores
  • Data selection: select the data relevant to the analysis

y

  • Data transformation: aggregation (daily sales to weekly or monthly

sales) or generalisation (street to city; age to young, middle age and ) g ( y g y g, g senior)

  • Data mining: apply intelligent methods to extract patterns

g

pp y g p

  • Pattern evaluation: interesting patterns should contradict the user’s

belief or confirm a hypothesis the user wished to validate f f yp

  • Knowledge presentation: visualisation and representation techniques

to present the mined knowledge to the users

23

p g

More on the KDD Process More on the KDD Process 60 to 80% of the KDD effort is about i th d t d th i i 20% preparing the data and the remaining 20% is about mining

24

slide-7
SLIDE 7

M th KDD P More on the KDD Process

  • A data mining project should always start with an

analysis of the data with traditional query tools

  • 80% of the interesting information can be extracted using SQL
  • how many transactions per month include item number 15?

how many transactions per month include item number 15?

  • show me all the items purchased by Sandy Smith.
  • 20% of hidden information requires more advanced techniques
  • which items are frequently purchased together by my customers?
  • how should I classify my customers in order to decide whether

future loan applicants will be given a loan or not?

25

D Mi i R l d Fi ld Data Mining: Related Fields

Database Statistics

Data Mining

M hi Machine Learning Visualization

26

Statistics, Machine Learning and Data Mining

  • Statistics
  • Statistics
  • more theory-based
  • more focused on testing hypotheses

more focused on testing hypotheses

  • Machine learning
  • more heuristic

more heuristic

  • focused on improving performance of a learning agent
  • also looks at real-time learning and robotics – areas not part of

data mining data mining

  • Data Mining and Knowledge Discovery
  • integrates theory and heuristics

integrates theory and heuristics

  • focus on the entire process of knowledge discovery, including

data cleaning, learning, and integration and visualization of results

27

  • Distinctions are fuzzy

More on Data Mining More on Data Mining

  • Data mining is sometimes also referred to as secondary data

Data mining is sometimes also referred to as secondary data analysis

  • Very large datasets have problems associated with them beyond

Very large datasets have problems associated with them beyond what is traditionally considered by statisticians

  • Many statistical methods require some type of exhaustive search

y q yp

  • Many of the techniques & algorithms used are shared by both

statisticians and data miner

  • While data mining aims at pattern detection statistics aims at

assessing the reality of a pattern

  • (example: finding a cluster of people suffering a particular disease

which the doctor will assess if it is random or not)

28

slide-8
SLIDE 8

DM and Non-DM examples DM an N n DM amp

Data Mining:

  • NOT Data Mining:

g

  • Certain names are

more prevalent in

  • NOT Data Mining:
  • Look up phone number

certain US locations (O’Brien, O’Rurke, O’Reilly in Boston Look up phone number in phone directory O Reilly… in Boston area)

  • Group together similar
  • Query a Web search

engine for Group together similar documents returned by search engine engine for information about “Amazon” according to their context (e.g. Amazon rainforest

29

rainforest, Amazon.com, etc.)

Rhine Paradox n ara

  • A great example of how not to conduct scientific

research.

  • David Rhine was a parapsychologist in the 1950’s who
  • David Rhine was a parapsychologist in the 1950 s who

hypothesized that some people had Extra-Sensory Perception (ESP) Perception (ESP).

  • He devised an experiment where subjects were asked

p j to guess 10 hidden cards --- red or blue. H d d h l 1 1000 h d E P h

  • He discovered that almost 1 in 1000 had ESP --- they

were able to get all 10 right!

30

Rhine Paradox Rhine Paradox

  • He told these people they had ESP and called them in

for another test of the same type.

  • Alas, he discovered that almost all of them had lost

their ESP their ESP.

  • What did he conclude?

What did he conclude?

You shouldn’t tell people that they have ESP: it p p y causes them to lose it

31

Rhine Paradox Rhine Paradox

  • What has really happened:

Th 1024 bi ti f d d bl There are 1024 combinations of red and blue combinations of red and blue of length 10. Thus with probability 0.98 at least one person (in 1000) will guess the sequence of red blue correctly will guess the sequence of red blue correctly

32

slide-9
SLIDE 9

Data Mining Applications Data Mining - Applications g pp

  • Market analysis and management

Market analys s and management

  • Target marketing, customer relation management, market basket

analysis, cross selling, market segmentation y , g, g

  • Find clusters of “model” customers who share the same

characteristics: interest, income level, spending habits, etc.

  • Determine customer purchasing patterns over time

Risk analysis and management

  • Risk analysis and management
  • Forecasting, customer retention, improved underwriting, quality

control competitive analysis credit scoring control, competitive analysis, credit scoring

34

Data Mining - Applications g pp

  • Fraud detection and management
  • Use historical data to build models of fraudulent behavior and use

data mining to help identify similar instances

  • Examples
  • auto insurance: detect a group of people who stage accidents to

g p p p g collect on insurance

  • money laundering: detect suspicious money transactions (US

Treasury's Financial Crimes Enforcement Network) Treasury s Financial Crimes Enforcement Network)

  • medical insurance: detect professional patients and ring of doctors

and ring of references (ex. doc. prescribes expensive drug to a Medicare g

( p p g

  • patient. Patient gets prescription filled, gets drug and sells drug unopened,

which is sold back to pharmacy)

35

Fraud Detection and Management Fraud Detection and Management

  • Detecting inappropriate medical treatment
  • Charging for unnecessary services, e.g. performing $400,000 worth
  • f heart & lung tests on people suffering from no more than a

ld Th t t d ith b th d t hi lf common cold. These tests are done either by the doctor himself or by associates who are part of the scheme. A more common variant involves administering more expensive blanket screening tests, rather than tests for specific symptoms

36

slide-10
SLIDE 10

Fraud Detection and Management Fraud Detection and Management

  • Detecting telephone fraud
  • Telephone call model: destination of the call, duration, time of day
  • r week. Analyze patterns that deviate from an expected norm.
  • British Telecom identified discrete groups of callers with frequent

intra-group calls especially mobile phones and broke a multimillion intra-group calls, especially mobile phones, and broke a multimillion dollar fraud.

  • ex. an inmate in prison has a friend on the outside set up an account at a

l l b d d h C ll f d d i ’ i lf i d h local abandoned house. Calls are forwarded to inmate’s girlfriend three states away. Free calling until phone company shuts down account 90 days later.

37

Other Applications Other Applications

  • Sports
  • IBM Advanced Scout analyzed NBA game statistics (shots blocked,

assists, and fouls) to gain competitive advantage for New York Knicks d Mi i H t and Miami Heat

  • Space Science
  • SKICAT automated the analysis of over 3 Terabytes of image data for

a sky survey with 94% accuracy

  • Internet Web Surf-Aid
  • Surf-Aid applies data mining algorithms to Web access logs for

market related pages to discover customer preference and behavior market-related pages to discover customer preference and behavior pages, analyzing effectiveness of Web marketing, improving Web site

  • rganization, etc.

38

Other Applications Other Applications

  • Social Web and Networks
  • There are a growing number of highly-popular user-centric

applications such as blogs, folksonomies, wikis and Web communities that generate a lot of structured and semi- structured information.

  • Ranking of social bookmark search results. Aggregating bookmarks.
  • Models to explain and predict the evolution of social networks
  • Personalized search for social interaction
  • User behaviour prediction
  • Discovering social structures and communities
  • Topic detection and topic trend analysis

39

Projects you can get involved in Projects you can get involved in

  • Wine tasting panel data analysis and Studying the

impact of weather changes on wine quality (advid)

  • Operating room capacity planning and scheduling
  • ptimization (CHP / KAIZEN)
  • ptimization (CHP / KAIZEN)
  • Loyalty card churning analysis (Modelo Continente)

Loyalty card churning analysis (Modelo Continente)

40

slide-11
SLIDE 11

Data Mining: On What Kind of Data? Data Mining: On What Kind of Data?

  • DM should be applicable to any kind of info. repository.
  • Relational databases
  • Data warehouses
  • Transactional databases
  • Advanced DB and information repositories
  • Object-oriented and object-relational databases
  • Spatial databases
  • Time-series data and temporal data
  • Text databases and multimedia databases

Text databases and multimedia databases

  • Heterogeneous and legacy databases
  • WWW

41

  • Scientific data (DNA)

D t Mi i T k Data Mining Tasks

Association (correlation and causality)

  • Multi-dimensional vs. single-dimensional association
  • age(X, “20..29”) ^ income(X, “20..29K”)  buys(X, “PC”)

[support = 2%, confidence = 60%]

  • buys(T, “computer”)  buys(x, “software”) [1%, 75%]

42

Data Mining Tasks Data Mining Tasks

Cl ifi ti d P di ti

  • Classification and Prediction
  • Finding models (functions) that describe and
  • Finding models (functions) that describe and

distinguish classes or concepts for future prediction prediction

  • E.g., classify countries based on climate, or classify cars based
  • n gas mileage

g g

  • Presentation: decision-tree, classification rule,

neural network neural network

  • Prediction: Predict some unknown or missing

numerical values

43

numerical values

Training Dataset Training Dataset

age income student credit_rating buys_computer <=30 high no fair no <=30 high no excellent no 30…40 high no fair yes >40 medium no fair yes y >40 low yes fair yes >40 low yes excellent no 31…40 low yes excellent yes y y <=30 medium no fair no <=30 low yes fair yes >40 medium yes fair yes y y <=30 medium yes excellent yes 31…40 medium no excellent yes 31…40 high yes fair yes This follows an example from Quinlan’s D3

44

g y y >40 medium no excellent no ID3

slide-12
SLIDE 12

Classification: A Decision Tree for Classification: A Decision Tree for “buys_computer”

45

Data Mining Tasks Data Mining Tasks Cl t l i

  • Cluster analysis
  • Class label is unknown: Group data to form new
  • Class label is unknown: Group data to form new

classes, e.g., cluster houses to find distribution patterns patterns

  • Clustering based on the principle: maximizing the

i t l i il it d i i i i th i t l intra-class similarity and minimizing the interclass similarity

46

Cluster Analysis Cluster Analysis

47

k Data Mining Tasks

  • Outlier analysis
  • Outlier: a data object that does not comply with the general
  • Outlier: a data object that does not comply with the general

behavior of the data

  • It can be considered as noise or exception but is quite useful in

It can be considered as noise or exception but is quite useful in fraud detection, rare events analysis

  • Trend and evolution analysis
  • Trend and deviation: regression analysis
  • Sequential pattern mining, periodicity analysis

48

  • Similarity-based analysis
slide-13
SLIDE 13

49

http://vis.computer.org/vis2006/Vis2006/Papers/outlier_preserving_focus_context.ppt

Data Mining Tasks Data Mining Tasks

The Power of Visualization

1 S i S h ELLSWORTH AVE T d BROADWAY b i

  • 1. Start out going Southwest on ELLSWORTH AVE Towards BROADWAY by turning

right. 2: Turn RIGHT onto BROADWAY 2: Turn RIGHT onto BROADWAY.

  • 3. Turn RIGHT onto QUINCY ST.
  • 4. Turn LEFT onto CAMBRIDGE ST.
  • 5. Turn SLIGHT RIGHT
  • nto MASSACHUSETTS AVE.
  • 6. Turn RIGHT onto RUSSELL ST.

50

Visualization for Problem Solving

From Visual Explanations by Edward Tufte, Graphics Press, 1997

51 Cholera Map, 1855

Anscombe’s quartet

X Y X Y X Y X Y 10 0 8 04 10 0 9 14 10 0 7 46 8 0 6 58 4 1 3 2

Anscombe s quartet

10.0 8.04 10.0 9.14 10.0 7.46 8.0 6.58 8.0 6.95 8.0 8.14 8.0 6.77 8.0 5.76 13.0 7.58 13.0 8.74 13.0 12.74 8.0 7.71 9.0 8.81 9.0 8.77 9.0 7.11 8.0 8.84 11 0 8 33 11 0 9 26 11 0 7 81 8 0 8 47 11.0 8.33 11.0 9.26 11.0 7.81 8.0 8.47 14.0 9.96 14.0 8.10 14.0 8.84 8.0 7.04 6.0 7.24 6.0 6.13 6.0 6.08 8.0 5.25 4.0 4.26 4.0 3.10 4.0 5.39 19.0 12.50 12.0 10.84 12.0 9.13 12.0 8.15 8.0 5.56 7.0 4.82 7.0 7.26 7.0 6.42 8.0 7.91 5.0 5.68 5.0 4.74 5.0 5.73 8.0 6.89 N 11 Mean of X 9.0 Mean of Y 7.5 Regression y = 3 + 0.5x Correlation coefficient (r) 0.82 Level of Explanation (r2) 0.67

52

F.J. Anscombe, “Graphs in Statistical Analysis” American Statistician, 27, pp 17-21, February 1973

slide-14
SLIDE 14

53

Visualization V ua za n

54

Visualization

55

Visualization

th b t h ?

Visualization - the best graph ever?

56

slide-15
SLIDE 15

Asia at night Asia at night

57

  • Check the site: http://www.visualcomplexity.com/vc/

The shape of the online

  • universe. This image

shows the hierarchical shows the hierarchical structure of the Internet, based on the connections between individual nodes (such as individual nodes (such as service providers). Three distinct regions are apparent: an inner core of highly connected nodes highly connected nodes, an outer periphery of isolated networks, and a mantle-like mass of peer- connected nodes The connected nodes. The bigger the node, the more connections it has. Those nodes that are closest to the center are connected the center are connected to more well-connected nodes than are those on the periphery.

58 http://www.technologyreview.com/player/07/06/19Rowe/1.aspx

Data Mining Methodology Data Mining Methodology

  • CRISP - Data Mining Process
  • Cross-Industry Standard Process for Data Mining (CRISP-DM)

Cross Industry Standard Process for Data Mining (CRISP DM)

  • European Community funded effort to develop framework for

data mining tasks data mining tasks

  • CRoss Industry - enables Leverage.
  • Standard Process - enables Competition.

59

http://www kdnuggets com/polls/2007/data mining methodology htm

60

http://www.kdnuggets.com/polls/2007/data_mining_methodology.htm

slide-16
SLIDE 16

CRISP DM goals CRISP-DM goals

  • General Objectives

j

  • Defining a cross industry data mining process and providing tool support,

allowing for cheaper, faster, and more reliable data mining.

  • Widespread adoption of the CRISP-DM process model.
  • Detailed Objectives
  • Ensure quality of Data Mining projects results.
  • Reduce skills required for Data Mining.
  • Capture experience for reuse.
  • General purpose (i.e., widely stable across varying applications, for example).
  • and robust (i e insensitive to changes in the environment)
  • and robust (i.e., insensitive to changes in the environment).
  • Tool and technique independent.
  • Tool supportable.

61

Why Should There be a Standard Process?

  • Framework for recording experience
  • Allows projects to be replicated

p j p

  • Aid to project planning and management

p j p g g

  • “Comfort factor” for new adopters
  • Comfort factor for new adopters
  • Demonstrates maturity of Data Mining
  • Reduces dependency on “stars”

62

  • Encourage best practices and help to obtain better results

Process Standardization

  • Initiative launched in late 1996 by three “veterans” of data mining market.
  • Daimler Chrysler (then Daimler-Benz), SPSS (then ISL) , NCR.
  • Developed and refined through series of workshops (from 1997-1999)
  • Over 300 organizations contributed to the process model

P bli h d CRISP DM 1 0 (1999)

  • Published CRISP-DM 1.0 (1999)
  • (current effort: CRISP-2.0 - Updating the Methodology)
  • Over 200 members of the CRISP-DM SIG worldwide
  • DM Vendors - SPSS, NCR, IBM, SAS, SGI, Data Distilleries, Syllogic, Magnify, ..
  • System Suppliers / consultants - Cap Gemini, ICL Retail, Deloitte & Touche, …
  • End Users - BT, ABB, Lloyds Bank, AirTouch, Experian, ...

63

CRISP DM CRISP-DM

  • Non-proprietary
  • Application/Industry neutral

Application/Industry neutral

  • Tool neutral
  • Focus on business issues
  • As well as technical analysis
  • As well as technical analysis
  • Framework for guidance
  • Experience base
  • Templates for Analysis

64

Templates for Analysis

slide-17
SLIDE 17

CRISP DM: Overview CRISP-DM: Overview

CRISP-DM is a comprehensive data mining methodology and g gy process model that provides anyone—from novices to data mining experts—with a complete blueprint for conducting a data mining project. CRISP-DM breaks down the life cycle of a data i i j t i t i mining project into six phases.

65

CRISP DM: Phases CRISP-DM: Phases

  • Business Understanding
  • Understanding project objectives and requirements; Data mining problem definition.
  • Data Understanding.
  • Initial data collection and familiarization; Identify data quality issues; Initial,
  • bvious results.
  • Data Preparation

Data Preparation

  • Record and attribute selection; Data cleansing.
  • Modelling
  • Run the data mining tools.
  • Evaluation
  • Determine if results meet business objectives; Identify business issues that should

have been addressed earlier.

  • Deployment

66

  • Deployment
  • Put the resulting models into practice; Set up for continuous mining of the data.

Phases and Tasks

Business Understanding Data Understanding Data Preparation Modelling Evaluation Deployment g g p Determine Business Collect Initial Select Select Modeling Evaluate Plan Business Objectives Assess Initial Data Describe Data Clean Modeling Technique Generate Results Review Deployment Plan Assess Situation Determine Describe Data Clean Data Test Design Review Process Monitoring & Maintenance Produce Determine Data Mining Goals Explore Data Construct Data Build Model Determine Next Steps Produce Final Report Produce Project Plan Verify Data Quality Integrate Data Assess Model Review Project

67

Format Data

True Legends of KDD

68

slide-18
SLIDE 18

True Legends of KDD

69

T L d f KDD True Legends of KDD

70

The Common Birth Date

  • A bank discovered that almost 5% of their customers were born on 11

N 1911 Nov 1911. The field was mandatory in the entry system. Hitting 111111 was the easiest way to get to the next field Hitting 111111 was the easiest way to get to the next field.

71

KD t KDnuggets

  • http://www.kdnuggets.com/
  • Is the leading source of information on Data Mining, Web Mining, Knowledge

Discovery, and Decision Support Topics, including News, Software, Solutions, Companies, Jobs, Courses, Meetings, Publications, and more.

  • KDnuggets News
  • Has been recognized as the #1 e-newsletter for the Data Mining and

Knowledge Discovery community

72

slide-19
SLIDE 19

73

l f P ll Results of a KDnuggets Poll

74

Results of a KDnuggets Poll gg

75

Weka 3 - Machine Learning Software in Java Weka 3 Machine Learning Software in Java

http://www.cs.waikato.ac.nz/~ ml/weka/

76

slide-20
SLIDE 20

R Project for Statistical Computing R - Project for Statistical Computing

Open source and lots of libraries available Open source and lots of libraries available.

77

SAS – Enterprise Miner p

78

SPSS – Clementine

79

Results of a KDnuggets Poll

What dataset format you use the most when data mining?

  • Feb. 2002

80

slide-21
SLIDE 21

Results of a KDnuggets Poll Results of a KDnuggets Poll

81

R lt f KDn t P ll Results of a KDnuggets Poll

Data preparation part in data mining projects? Oct 2003 Oct, 2003

82

Golden Rules for Data Mining

KDnuggets FAQ - Gregory Piatetsky-Shapiro

  • Focus on what is actionable.
  • Prepare and clean the data carefully.
  • Verify data analysis steps.

y y p

  • Use multiple data mining and machine learning methods.
  • Beware of "false predictors" (also called "information leakers") fields

p ( ) that appear to predict the outcome too well and are actually recording events that happened after the outcome happened. Find and eliminate them.

  • If the results are too good to be true, you probably have found false

predictors.

  • Examine the results carefully and repeat and refine the knowledge

discovery process until you are confident.

  • Did I emphasize that you should be beware of "false predictors"?

83

Did I emphasize that you should be beware of false predictors ?

A Brief History of Data Mining Society A Brief History of Data Mining Society

  • 1989 IJCAI Workshop on Knowledge Discovery in Databases (Piatetsky-Shapiro)

p g y y p

  • Knowledge Discovery in Databases (G. Piatetsky-Shapiro and W. Frawley, 1991)
  • 1991-1994 Workshops on Knowledge Discovery in Databases
  • Advances in Knowledge Discovery and Data Mining (U. Fayyad, G. Piatetsky-Shapiro, P. Smyth, and R.

Uthurusamy, 1996)

  • 1995-1998 International Conferences on Knowledge Discovery in Databases and

1995 1998 International Conferences on Knowledge Discovery in Databases and Data Mining (KDD’95-98)

  • Journal of Data Mining and Knowledge Discovery (1997)
  • 1998 ACM SIGKDD, SIGKDD’1999-2009 conferences, and SIGKDD Explorations
  • More conferences on data mining
  • PAKDD, PKDD, SIAM-Data Mining, (IEEE) ICDM, etc.

84

slide-22
SLIDE 22

Where to Find References? Where to Find References?

  • Data mining and KDD (SIGKDD member CDROM):
  • Conference proceedings: KDD, and others, such as PKDD, PAKDD, etc.
  • Journal: Data Mining and Knowledge Discovery
  • Database field (SIGMOD member CD ROM):

Database field (SIGMOD member CD ROM)

  • Conference proceedings: ACM-SIGMOD, ACM-PODS, VLDB, ICDE, EDBT, DASFAA
  • Journals: ACM-TODS, J. ACM, IEEE-TKDE, JIIS, etc.

AI d M hi L i

  • AI and Machine Learning:
  • Conference proceedings: Machine learning, AAAI, IJCAI, etc.
  • Journals: Machine Learning, Artificial Intelligence, etc.

g g

  • Statistics:
  • Conference proceedings: Joint Stat. Meeting, etc.

J n ls: Ann ls f st tisti s t

  • Journals: Annals of statistics, etc.
  • Visualization:
  • Conference proceedings: CHI, etc.

85

p g

  • Journals: IEEE Trans. visualization and computer graphics, etc.

Books on Data Mining Books on Data Mining

  • Data Mining: A Tutorial-based Primer -- Michael Geatz, Richard,

Richard (Addison Wesley - 2003) Richard (Addison Wesley 2003)

  • Principles of Data Mining, David J. Hand, Heikki Mannila, Padhraic

Smyth (MIT press – 2001)

  • Data Mining: Concepts and Techniques, Jiawei Han, Micheline Kamber

(Morgan Kaufmann - 2000) Second edition - 2006

  • Mastering Data Mining Michael Berry and Gordon Linoff (John Wiley
  • Mastering Data Mining, Michael Berry and Gordon Linoff (John Wiley

& Sons Inc – 2000)

  • Data Mining, Practical Machine Learning Tools and Techniques with

J I l t ti I H Witt Eib F k (M K f Java Implementations Ian H. Witten, Eibe Frank (Morgan Kaufmann - 1999) Second-edition - 2005

  • Data Mining Techniques: Marketing, Sales and Customer Support,

g q g, pp , Michael Berry, Gordon Linoff (John Wiley & Sons Inc – 1997)

  • Mining the Web: Discovering Knowledge from Hypertext Data,

Soumen Chakrabarti (Morgan Kaufmann – 2002)

86

Soumen Chakrabarti (Morgan Kaufmann 2002)

Thank you !!! Thank you !!!

87

Thank you !!! Thank you !!!