Introduction Problem: Reliable routing on wireless sensor networks - - PDF document

introduction
SMART_READER_LITE
LIVE PREVIEW

Introduction Problem: Reliable routing on wireless sensor networks - - PDF document

Introduction Problem: Reliable routing on wireless sensor networks Focus on lossy, dynamic nature of wireless networks Consider constraints on memory and power Taming the Underlying Challenges of Proposed approach Reliable Multihop


slide-1
SLIDE 1

1

Taming the Underlying Challenges of Reliable Multihop Routing in Sensor Networks

by

Alec Woo, Terence Tong, David Culler

presented by

Mark Wood

2 - Mark Wood – 11/ 21/ 2005

Introduction

Problem: Reliable routing on wireless sensor networks

»Focus on lossy, dynamic nature of wireless networks »Consider constraints on memory and power

Proposed approach

»Time averaged link estimator (WMEWMA) »Frequency-based neighbor table management »Cost-based routing

Empirical observations of reception Analysis of link estimation Evaluation of table management techniques Evaluation of routing protocols

3 - Mark Wood – 11/ 21/ 2005

Routing Component Interactions

Application Parent Selection Table Management Neighbor Table Estimator Cycle Detection Timer

Originating Queue Forward Queue Run parent selection and send route message periodically Route or originated data message

  • Insert or discard

Route message

  • Save information

Filter

All message

  • sniff and

estimate Data message Forwarding message

All Messages

  • discard non data packet
  • discard duplicate packet

Cycle detected

  • choose other parent

Send route update message Send originated data message 4 - Mark Wood – 11/ 21/ 2005

Empirical Link Characteristics, Test 1

Test environment

»Motes arranged linearly on a tennis court »Spacing of 2 feet

Test

»1 node transmits 200 packets at 8 packets/ sec »Remaining nodes count the number of packets received »Test is repeated for each node

Results

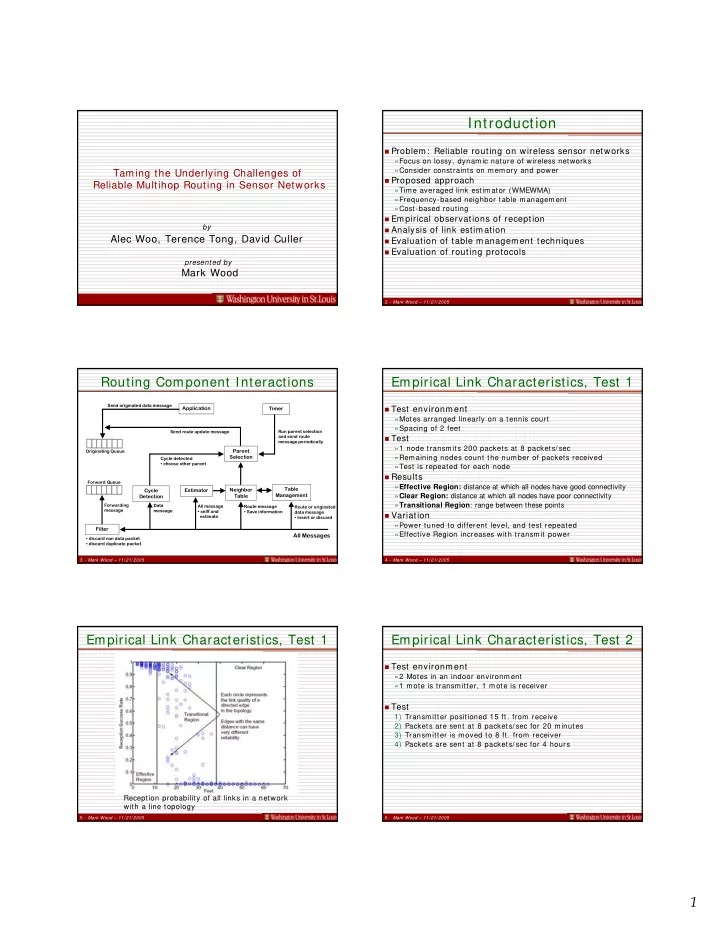
»Effective Region: distance at which all nodes have good connectivity »Clear Region: distance at which all nodes have poor connectivity »Transitional Region: range between these points

Variation

»Power tuned to different level, and test repeated »Effective Region increases with transmit power

5 - Mark Wood – 11/ 21/ 2005

Empirical Link Characteristics, Test 1

Reception probability of all links in a network with a line topology

6 - Mark Wood – 11/ 21/ 2005

Empirical Link Characteristics, Test 2

Test environment

»2 Motes in an indoor environment »1 mote is transmitter, 1 mote is receiver

Test

1) Transmitter positioned 15 ft. from receive 2) Packets are sent at 8 packets/ sec for 20 minutes 3) Transmitter is moved to 8 ft. from receiver 4) Packets are sent at 8 packets/ sec for 4 hours

slide-2
SLIDE 2

2

7 - Mark Wood – 11/ 21/ 2005

Empirical Link Characteristics, Test 2

Results

» Link quality abruptly changes » Mean link quality is relatively stable at a given distance » High variation in instantaneous link quality

8 - Mark Wood – 11/ 21/ 2005

Empirical Observations

Distribution

»Small, irregular region of good connectivity »Some distant nodes with good connectivity »Large, irregular region of poor connectivity »Some asymmetric links

Individual node reception

»Receive packets frequently from small group of good neighbors »Receive packets less frequently from large group of more distant nodes »More weakly-connected nodes than well-connected nodes »More packet loss from weakly-connected nodes »More frequent reception from well-connected nodes

9 - Mark Wood – 11/ 21/ 2005

Link Quality Model

Empirical observations suggest a probabilistic link

behavior

Goal: Predict link quality of neighboring nodes Link quality model

»Compute the mean and variance from empirical data »For each node pair, associate a probability based on this

Can be used in design of neighbor management policy

10 - Mark Wood – 11/ 21/ 2005

Connectivity Cell

Cell connectivity of a node in a grid with 8-foot spacing using link quality model

11 - Mark Wood – 11/ 21/ 2005

Link Estimation

Ideal estimator

» React quickly » Estimations stable » Memory footprint small » Computation load small

Active: Probe the links

» Used in wired networks (IGRP, EI GRP)

Passive: Collect statistics on packets it hears

» Easy to do in wireless networks » But must listen to packets not addressed to it

Synthetic loss generators evaluated:

» Linear regression on Kalman filters » Exponentially weighted moving average (EWMA) » Moving average » Time weighted moving average » Packet loss/ success interval with EWMA » Window mean with EWMA (WMEWMA)

12 - Mark Wood – 11/ 21/ 2005

WMEWMA

Computes average success rate over time period Packets Received in t WMEWMA(t, α) = max(Packets Expected in t, Packets Received in t)

where t is time window and α controls history of estimator.

EWMA smoothens the average Tuned for two settings

»Stable: minimize the settling time »Agile: minimize the mean squared error

slide-3
SLIDE 3

3

13 - Mark Wood – 11/ 21/ 2005

WMEWMA Performance

WMEWMA (t = 30, α = 0.6) with stable setting using empirical traces

14 - Mark Wood – 11/ 21/ 2005

Link Quality Distribution

A center node in an 80x80 grid with 4 feet spacing has up to 207 neighbors with varying link quality 75% is “good neighbor” quality 30% of the nodes

15 - Mark Wood – 11/ 21/ 2005

Choosing Neighbors

Want to keep a sufficient number of good neighbors in

the table

The table should reflect which nodes are most useful for

routing

Want to discard nodes with low-quality links Lim ited space

16 - Mark Wood – 11/ 21/ 2005

Neighbor Table

Contains status and routing entries for neighbors Fields include:

»MAC address »Routing cost »Parent address »Child flag »Reception link quality »Send link quality »Link estimator data structures

Insertion, eviction and reinforcement is done by the

Neighbor Table Manager

17 - Mark Wood – 11/ 21/ 2005

Replacement Algorithms

FIFO: First-I n-First-Out

» Cycles through the neighbors in round-robin style » Eviction is based on order of entry, so no reinforcement

CLOCK: Approximation of Least-Recently-Used (LRU)

» Cursor cycles through neighbors looking for unmarked one » If neighbor is marked, then unmark it and go to next one » When neighbor is loaded into memory, mark it » When neighbor has been referenced, mark it

LRH: Least-Recently Heard

» Resident entry is made most recently heard

FREQUENCY: Simple policy to estimate frequency

» Keeps a frequency count for each entry in the table

18 - Mark Wood – 11/ 21/ 2005

Replacement Algorithm Comparison

Number of good neighbors maintainable at different densities with a table size of 40 entries

slide-4
SLIDE 4

4

19 - Mark Wood – 11/ 21/ 2005

Parent Selection

Cost: An abstract measure of distance

»Estimate of energy required to reach destination

Cost metrics

»Number of hops »Expected number of transmissions »Other estimate of cost

Other reasons for switching to a new parent:

»Link quality drops below threshold »Sink is unreachable through current parent »Cycle is detected

20 - Mark Wood – 11/ 21/ 2005

Packet Snooping

All packets are broadcast Every node is a “router” Snooping helps prevent cycles Child Pruning:

»Node receives a forwarding message with an unreachable route »Message is forwarded with a ‘NO_ROUTE’ address »Neighbors snoop the message and learn about unreachable route

Solves counting-to-infinity problem

21 - Mark Wood – 11/ 21/ 2005

Counting to Infinity - Example

Nodes represent costs to reach sink Link betw een B and sink fails B hears of a route to sink via A w ith cost 2 B sw itches to the “better” ( but invalid) route A hears from B and increases its cost Cycle continues as w e count to infinity…

A/2 B/1 A/2 B/1 A/2 B/1 A/2 B/3 A/4 B/3

update update

[Geoffrey M. Voelker, UCSD]

22 - Mark Wood – 11/ 21/ 2005

Cycle Prevention

Why im portant?

»In wireless networks, bandwidth is the most scarce resource

Classic techniques to control cycles Split-Horizon: Routes are prevented from exiting the interface where they were received Poison-Reverse: Routes heard through an interface are sent out that interface with metric = infinity Applying sim ilar techniques to motes:

»Route invalidation when a node becomes disjoint »Tree pruning by ‘NACKing’ children’s traffic

23 - Mark Wood – 11/ 21/ 2005

Duplicate Packet Elimination

Duplicate packets

»Created upon retransmission when ACK is lost »If forwarded, can cause more retransmissions »Cause contention »Wasted energy

Proposed solution

»Sender ID and Sequence Number appended to header »Parent retains originator ID and originating sequence number of child entries in neighbor table

24 - Mark Wood – 11/ 21/ 2005

Queue Management

When forwarding messages dominate the queue

»Prevents node from originating data »Prevents cycle detection

Queuing technique

»Separate forwarding and originating messages into two queues »Priority given to originating messages »Fair queuing policy is implemented

slide-5
SLIDE 5

5

25 - Mark Wood – 11/ 21/ 2005

Distance Vector Algorithm (Bellman-Ford)

Iterates on num ber of hops to find shortest-path

spanning tree

Each node sends its entire routing table to its neighbor Distributed version of Bellman-Ford (DBF) Prone to cycles Slow convergence Requires less computation Less widespread traffic Convergence Time

  • The time for a group of devices to agree on the topology after a change
  • The time from when a route is invalidated until an alternate is installed

26 - Mark Wood – 11/ 21/ 2005

Destination Sequenced Distance Vector (DSDV)

Perkins, Bhagwat, SIGCOMM ‘94 Designed for ad-hoc networks

»Each mobile host is a router »Each one advertises its view of the interconnection topology

Modified version of Bellman-Ford

»Uses a sequence number to distinguish stale routes from good

  • nes

»Sequence numbers are generated by the destination computer »Settling time table is used to prevent fluctuations

Uses hop count as cost metric

»Considers all nodes it hears as neighbors »Ignores link quality »Problem: some of the hops along the path may be bad

27 - Mark Wood – 11/ 21/ 2005

Improvements to DSDV

Uses other cost metric: minimum expected transmissions Uses link quality estimations

» using WMEWMA to compute the average

Uses a Minimum Transmission (MT) metric

1 1 MT = X link qualityforward link qualitybackward

Uses packet loss for link failure detection Uses neighbor table management

» Gets rid of “bad” neighbors in the table » Uses FREQUENCY algorithm » Puts neighbors in logical order in the table

28 - Mark Wood – 11/ 21/ 2005

Evaluations (1)

Hop distribution from simulations

MT = Minimum Transmission MTTM = MT with FREQUENCY SP(t) = Shortest Path with threshold t DSDV = Destination Sequenced Distance Vector Protocol

29 - Mark Wood – 11/ 21/ 2005

Evaluations (2)

Stability from sim ulations

MT = Minimum Transmission MTTM = MT with FREQUENCY SP(t) = Shortest Path with threshold t DSDV = Destination Sequenced Distance Vector Protocol

30 - Mark Wood – 11/ 21/ 2005

Evaluations (3)

End-to-end success rate over distance

MT = Minimum Transmission SP(t) = Shortest Path with threshold t MT Congested = MT on congested network

slide-6
SLIDE 6

6

31 - Mark Wood – 11/ 21/ 2005

Evaluations (4)

Stability of the entire network

MT = Minimum Transmission MT Congested = MT on congested network

32 - Mark Wood – 11/ 21/ 2005

Evaluations (5)

Link estimation over time

MT = Minimum Transmission MT Congested = MT on congested network

33 - Mark Wood – 11/ 21/ 2005

Conclusions

Link quality estimation is important in routing decision Neighbor table management with constant space is

needed

FREQUENCY performs well in table management Minimum expected transm issions is an effective cost

metric

The combination of these techniques outperforms

previous protocols

34 - Mark Wood – 11/ 21/ 2005

BOOST

Problem: WMEWMA only computes average link quality

» Not good enough for real-time » Worst-case link quality and contention time are needed for routing decisions

Solution: Use Jacobson’s algorithm

» Keeps track of the average and deviation of packet reception rate (PRR) and contention delay » Allows BOOST to better estimate current worst-case delay under the current workload

Problem: MT cannot fulfill deadline requirements

» The neighbor management scheme is not cognizant of delays » Does not always insert neighbors that can meet the velocity requirement

Solution: Two new insertion policies

» Power Adaptation: When velocity requirements are met, increase transmission power. When requirements met, decrease it. » Neighbor Discovery: When requirements not met, identify a node that meets the velocity requirements

35 - Mark Wood – 11/ 21/ 2005

Discussion Questions [ Jon Turner]

What are the contributions? Are the authors’ design choices adequately justified? Is performance evaluation satisfactory? What about processing requirements?