introduction
play

Introduction X-ray Imaging Dose to Patients in the Era of - PDF document

Introduction X-ray Imaging Dose to Patients in the Era of Image-guided radiation therapy (IGRT) has dramatically Image-Guided Radiation Therapy improved the accuracy of radiotherapy IGRT has emerged as the new paradigm in radiotherapy.


  1. Introduction X-ray Imaging Dose to Patients in the Era of � Image-guided radiation therapy (IGRT) has dramatically Image-Guided Radiation Therapy improved the accuracy of radiotherapy � IGRT has emerged as the new paradigm in radiotherapy. George Ding, Ron Price, Charles Coffey � X-ray imaging, such as cone-beam CT (CBCT), for patient Vanderbilt-Ingram Cancer Center setup can add radiation dose to patients. Vanderbilt University Medical Center, Nashville, TN � Additional imaging dose may entail biological risk � How much are the imaging doses to patients? CE: AAPM 2008, 7/31/2008, Houston, TX Electronic portal imaging device (EPID) 
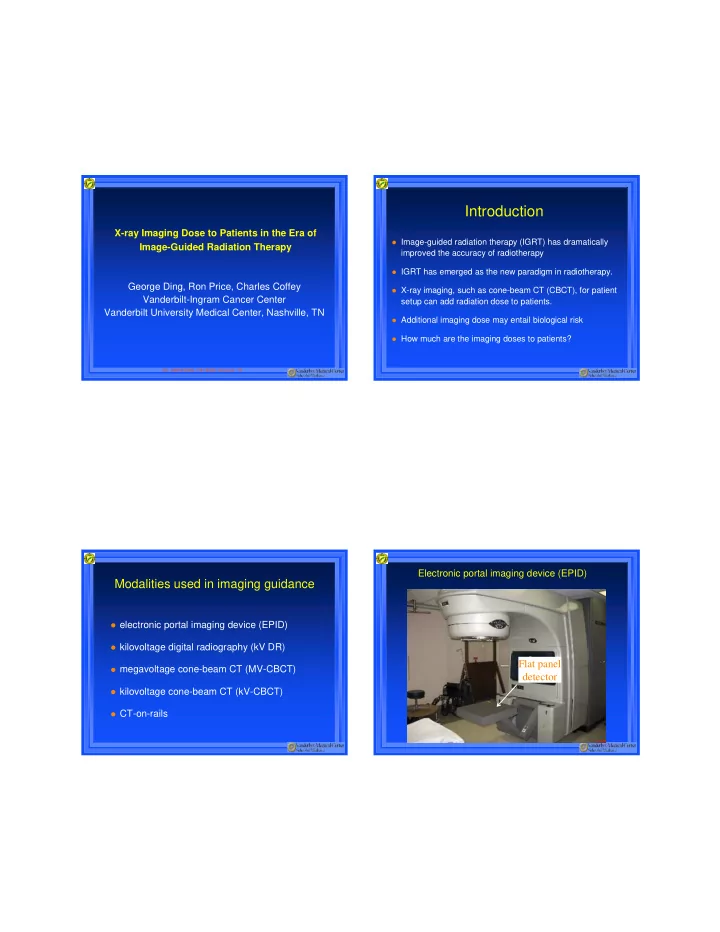
Modalities used in imaging guidance � electronic portal imaging device (EPID) � kilovoltage digital radiography (kV DR) Flat panel � megavoltage cone-beam CT (MV-CBCT) detector � kilovoltage cone-beam CT (kV-CBCT) � CT-on-rails

  2. MV AP setup field (Head and Neck) MV AP setup field MVCT on Linac unit MV AP setup field (double exposure)

  3. MVCT images MVCT images Images of MVCT Tomotherapy unit MVCT on Tomotherapy unit

  4. CT-on-rail system Images of MVCT Tomotherapy unit kV CBCT system kV CBCT system

  5. kV Lat setup field kV CBCT application for SBRT- Lung kV CBCT application for SBRT- Prostate kV CBCT application for SBRT- spine

  6. Monitoring treatment progress and ART Feasibility of kV CBCT for treatment planning Information from 2D images Information from images � 3D images from cone-beam CT : � 2D projected verification images : – Can be viewed in axial, coronal, and saggittal – Bony anatomy relative to treatment isocenter reconstructions from the volumetric images – Seeds position relative to treatment field – Organ shape and position relative to isocenter – Two orthogonal project images for 3D positioning – Small lung tumor – Treatment field shaped by MLC – Can be used for monitor treatment progress and adaptive radiotherapy (ART)

  7. Radiation doses Radiation doses cont… � Detailed list see AAPM TG-75 � 2D projected verification images : � 2D projected verification images : – kV beams from OBI device ( ~ mGy/field) – MV beams EPID ( 1-2 MU ~ 1- 2 cGy/field) • Setup fields: two orthogonal beams • Setup fields: two orthogonal beams • mAs can be automatically adjusted (patient size ↑ → dose ↑ ) • Treatment portal field • Dose rapidly decreases as a function of depth in patient – can be acquired during treatment (no additional dose) – Before or after ( can be added to total dose) • Double exposure (area larger than the treatment field) Dose dependency on depth Radiation doses cont… � CBCT volumetric images : – scan area is larger than the treatment field (~cGy/scan) – Standard acquisition mode – Low-dose acquisition mode – For the same scan (patient size ↓ → dose ↑ )

  8. Dose dependency on medium for kV beam Dose dependency on medium for MV beam 220 110 125 kVp 200 6 MV 100 180 90 Bone slabs in water Monte Carlo 160 80 Density corrected 140 70 e dose e dose Monte Carlo 120 60 Density corrected Relativ Relativ 100 50 80 40 60 30 Bone slabs in water 40 20 20 10 0 0 0 2 4 6 8 10 12 14 16 18 20 0 2 4 6 8 10 12 14 16 18 20 depth in phantom /cm depth in phantom /cm Slab of water Isodose distributions: single AP X-ray (CBCT beam) no bow-tie 20 cm thickness A X-rays (125 kVp) B 125 kVp x-rays used for CBCT from a Varian Trilogy

  9. Dose profiles along the line A-B on chest CT: kV vs. MV Isodose distributions: single AP 6 MV beam 350 Single AP field A Sternum 300 (bone) 6 MV beam 250 125 kV beam e dose 200 Relativ Vertebrae 150 (bone) 100 B 50 0 0 2 4 6 8 10 12 14 16 18 B A Depth / cm central-axis depth in patient /cm Dose distributions resulting from a kV CBCT Bone Water EYE Head and Neck Lung 10 Brain, Grey/White matter µ en / ρ /(cm 2 /g) Tissue, soft Blood Air, Dry 1 0.1 0.01 0.01 0.1 1 Energy of photons /MeV MUE n8 Data are from: J. H. Hubbell and S. M. Seltzer, "Tables of X-Ray Mass Attenuation Coefficients and Mass Energy-Absorption Coefficients," National Institute of Standards and Technology, Gaithersburg, MD NISTIR 5632, 1995.

  10. Results of dose-volume-histogram analysis for H&N scan 100 Adult Cord 90 Half-Fan mode 80 Eye 70 % volume Cervical vertebral 60 Brain 50 30 30 40 Line C Body Line A Line D Line B 25 25 30 20 20 dose /cGy dose /cGy 20 15 15 10 10 10 0 5 0 5 10 15 20 25 30 5 dose /cGy 0 0 -15 -10 -5 0 5 10 15 -15 -10 -5 0 5 10 15 X direction /cm X direction /cm Dose distributions resulting from a kV CBCT Results of dose-volume-histogram analysis for chest scan Chest 100 Adult chest 90 Lt lung 80 Bone 70 % volume Rt lung 60 50 40 30 Cord Body 20 10 0 0 5 10 15 20 25 30 dose /cGy

  11. Dose distributions resulting from MV-CBCT: pelvic scan Results of dose-volume-histogram analysis for a pelvic kV CBCT scan Large Adult 100 Adult 90 80 Femoral head 70 % volume 60 Body 50 40 Rectum 30 20 Prostate 10 0 0 5 10 15 20 25 30 dose /cGy Summary Summary cont... Doses from image-guided procedures Commonly used image-guided procedures � MV imaging: � MV imaging: – MV-EPI: ~ 1-2 cGy /acquisition – megavoltage electronic portal imaging (MV-EPI) – megavoltage cone-beam CT (MV-CBCT) – megavoltage cone-beam CT (MV-CBCT) • Linac unit: ~ 5 – 20 cGy /acquisition • On Linac unit • Tomotherapy unit: 8-12 cGy • On Tomotherapy unit � kV imaging: � kV imaging: – kV DR: ~ mGy (entrance dose) – kilovoltage digital radiography (kV DR) – kV-CBCT – kilovoltage cone-beam CT (kV-CBCT) • Soft tissue: 2 - 8 cGy /acquisition – CT-on-rail • Bone: 8 - 25 cGy /acquisition

  12. Summary cont... Summary cont... � Imaged area is larger than the treatment field � MV beam imaging: – Dose resulting from MV-CBCT is comparable to that of multiple � Imaging-guidance procedures are more frequent than portal imaging acquisitions diagnostic imaging – Negligible difference between dose to bone and dose to soft � Repeated imaging procedures can sum up significant tissues dose to radiosensitive organs � kV x-ray imaging: � kV DR imaging: high entrance dose – Dose resulting from kV-CBCT is much larger than that of multiple exit dose (~ 5% of entrance dose) kV DR acquisitions � – Dose to bone is 2-4 times higher than the dose to soft tissues � MV EPID imaging: exit dose (~50% of entrance dose) – Dose to bone marrow? ( see Kawrakow et al WE-E-332-04) What to do now? Acknowledgements � Improve imaging technology (manufactures) – Increase image quality and decrease the dose to patients – Progress is being made Matthew Deeley, Vanderbilt University Use imaging guidance efficiently: � Kenneth Lewis, Vanderbilt University – Choose the procedure and the frequency that is most suitable for Fitz-William Taylor, visiting student from USMA at West Point the purpose ACCRE Vanderbilt Advanced Computing Center for – Develop protocols for using image guidance procedures Research and Education – Pay attention to pediatric patients and imaged volume � Account imaging guidance dose for radiotherapy patients – Calculate organ doses resulting from image guided procedures – Account them as part of total dose to patients in radiotherapy treatment planning systems

Download Presentation
Download Policy: The content available on the website is offered to you 'AS IS' for your personal information and use only. It cannot be commercialized, licensed, or distributed on other websites without prior consent from the author. To download a presentation, simply click this link. If you encounter any difficulties during the download process, it's possible that the publisher has removed the file from their server.

Recommend


More recommend