SLIDE 1 30/ 11/ 2016 1
EFFECT OF SEED DENSITY AND NUTRIENT SOURCE ON PRODUCTION AND QUALITY OF GREEN HOUSE FODDER AS DAIRY CATTLE FEED
SEAG International Workshop :
Tropical Bio-resources for Sustainable Development
Bogor, 13-15 August, 2014
Idat G. Permana, Despal & Dara M elisa Dapartment of Animal Nutrition and Feed Technology Faculty of Animal Science - Bogor Agricultural University www.ipb.ac.id
INTRODUCTION
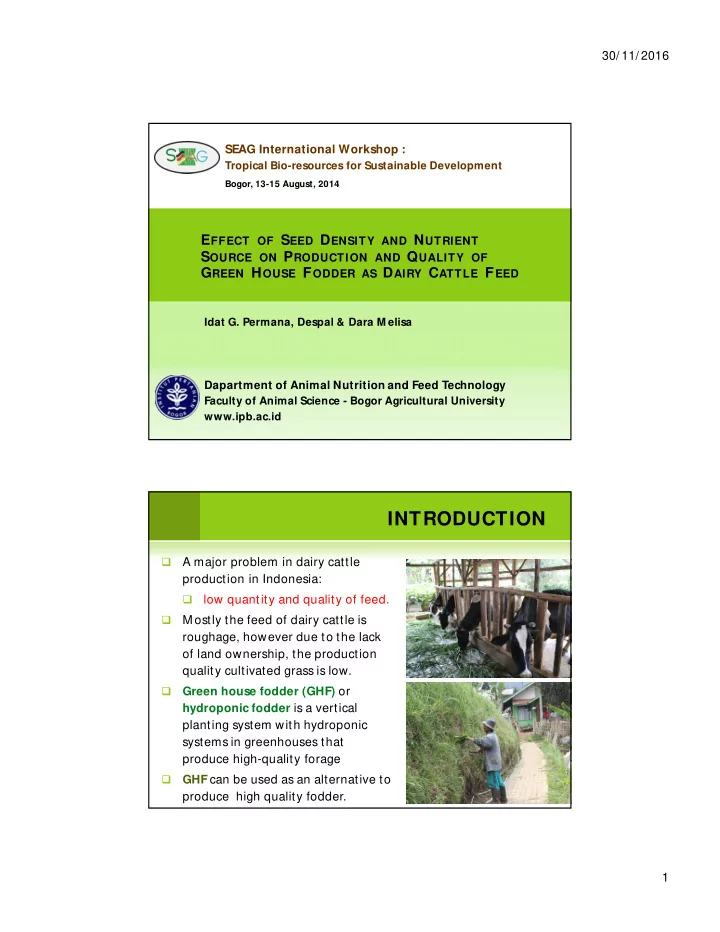
A major problem in dairy cattle production in Indonesia:
low quantity and quality of feed.
M ostly the feed of dairy cattle is roughage, however due to the lack
- f land ownership, the production
quality cultivated grass is low.
Green house fodder (GHF) or hydroponic fodder is a vertical planting system with hydroponic systems in greenhouses that produce high-quality forage
GHF can be used as an alternative to produce high quality fodder.
SLIDE 2 30/ 11/ 2016 2
INTRODUCTION
Benefits of GHF are: CP and digestibility increase, increase of availability some vitamin.
Grains: corn, wheat, barley, sorghum, etc.
GHF production influenced by:
Nutrient Supply, Grain Variety and Quality, Temperature, Humidity, Depth and Seed Density.
Bioslurry is effluent that produced from biogas digester, containt rich nutrient for plant.
OBJECTIVES
T
- study the effect of bioslurry from biogas
digester as nutrient solution and seed density on production and quality of corn hydroponic fodder.
SLIDE 3
30/ 11/ 2016 3
METHODOLOGY
Location:
IPB University Farm’s green house, Darmaga, Bogor
Green House Fodder (GHF) Production:
Corn GHF was produced on hydroponic system with addition different nutrient solutions and different seed density.
Nutrient solutions:
0% bioslurry + 100% commercial nutrient solution
25% bioslurry + 75% commercial nutrient solution
50% bioslurry + 50% commercial nutrient solution
Seed density:
350 g/ tray, 450 g/ tray and 500 g/ tray
Corn were grown for 8 days
GHF PRODUCTION
STEP ACTIVITIES
1. Seed selection 2. Soaking in water for 24 hours 3. Washing with clean water 4. Placed in trays, spraying with nutrient solution for 7-8 times, or used aoutomatic watering system 5. Harvesting after 8 days
SLIDE 4
30/ 11/ 2016 4
METHODOLOGY
Parameters:
Fresh and DM biomass yield, plant growth,
nutrient content (ash, crude protein, crude lipid, crude fibre and nitrogen free extract), DM in vitro digestibility, total volatile fatty acids (VFA) and ammonia (NH3) concentration Experimental design:
A factorial (3 x 3) design Data analyses using ANOVA
GHF PRODUCTION
SLIDE 5
30/ 11/ 2016 5
GHF PRODUCTION
Harvesting of corn GHF
GHF PRODUCTION
SLIDE 6 30/ 11/ 2016 6
PLANT GROWTH
Seed Density (g/ tray) Bioslurry Percentage (%) Average 25 50 350 28.37 ± 6.40 29.13 ± 6.76 19.60 ± 6.26 25.72 ± 7.26 450 28.80 ± 4.69 24.90 ± 5.07 25.50 ± 5.07 26.40 ± 4.65 500 30.51 ± 1.75 25.70 ± 4.66 21.37 ± 1.93 25.73 ± 5.22
Average
29.10 ± 0.92b 26.60 ± 2.29b 22.16 ± 3.03a
Table 1. Effect of bioslurry as nutrient solution and seed density on average of plant height (cm/ day) of corn GHF
PLANT GROWTH
5 10 15 20 25 30 1 2 3 4 5 6 7 8
Plant height (cm) Day
SLIDE 7
30/ 11/ 2016 7
FRESH BIOMASS YIELD
Seed Density (g/ tray) Bioslurry Percentage (%) Average 25 50 350 674 ± 141 862.33 ± 127 610 ± 144 715 ± 165a 450 924 ± 81 929.33 ± 159 712 ± 251 855 ± 188b 500 1056 ± 113 912.33 ± 86 830 ± 39 933 ± 123b Average 884 ± 194b 901 ± 35b 717 ± 110a
Table 2. Effect of bioslurry as nutrient solution and seed density on fresh biomass yield (% DM ) of corn GHF
CRUDE PROTEIN CONTENT
Seed Density (g/ tray) Bioslurry Percentage (%) Average 25 50 350 14.09 ± 1.52 12.94 ± 0.88 12.68 ± 0.91 13.24 ± 1.18 450 14.57 ± 1.58 13.97 ± 2.43 14.76 ± 0.40 14.43 ± 1.50 500 13.83 ± 0.46 14.12 ± 1.89 13.74 ± 1.39 13.90 ± 1.21 Average 14.16 ± 0.38 13.68 ± 0.64 13.73 ± 1.04
Table 3. Effect of bioslurry as nutrient solution and seed density on crude protein (CP) content (% DM ) of corn GHF
SLIDE 8
30/ 11/ 2016 8
CRUDE LIPID CONTENT
Seed Density (g/ tray) Bioslurry Percentage (%) Average 25 50 350 5.40 ± 1.45 3.36 ± 1.76 4.29 ± 0.30 4.35 ± 1.45 450 4.70 ± 0.18 4.47 ± 0.52 2.99 ± 1.29 4.05 ± 1.07 500 3.94 ± 0.31 3.80 ± 0.15 3.86 ± 0.05 3.87 ± 0.19 Average 4.68 ± 0.73 3.88 ± 0.56 3.72 ± 0.66
Table 4. Effect of bioslurry as nutrient solution and seed density on crude lipid (CL) content (% DM ) of corn GHF
CRUDE FIBRE CONTENT
Seed Density (g/ tray) Bioslurry Percentage (%) Average 25 50 350 3.92 ± 1.89 4.21 ± 1.63 4.69 ± 0.83 4.27 ± 1.36 450 5.39 ± 0.82 5.54 ± 1.13 4.97 ± 1.45 5.30 ± 1.04 500 4.48 ± 0.22 4.59 ± 1.61 2.84 ± 0.19 3.97 ± 1.18 Average 4.60 ± 0.74 4.78 ± 0.68 4.17 ± 1.16
Table 5. Effect of bioslurry as nutrient solution and seed density on crude fibre (CF) content (% DM ) of corn GHF
SLIDE 9 30/ 11/ 2016 9
NFE CONTENT
Seed Density (g/ tray) Bioslurry Percentage (%) Average 25 50 350 68.66 ± 1.27 74.38 ± 3.13 73.87 ± 1.85 72.31 ± 3.35a 450 70.23 ± 3.51 70.03 ± 2.44 71.90 ± 3.76 70.72 ± 2.98a 500 73.00 ± 1.60 74.65 ± 3.19 76.91 ± 1.73 74.85 ± 2.61b Average 70.63 ± 2.20a 73.02 ± 2.60b 74.23 ± 2.52a
Table 6. Effect of bioslurry as nutrient solution and seed density
- n nitrogen free extract (NFE) content (% DM ) of corn GHF
CORN GRAIN VS CORN GHF
1.8
10.6
1.3 3.1 83.2 4.9
13.9
4.5 4.1 72.6 Ash CP CL CF NFE
Corn Grain Corn GHF
SLIDE 10 30/ 11/ 2016 10
50 60 70 80 90 100 0% Bioslurry 25% Bioslurry 50% Bioslurry
79% 85% 83%
In vitro Digestibility (%)
Corn GHF Digestibility (% DM )
DRY MATTER DIGESTIBILITY
Seed Density (g/ tray) Bioslurry Percentage (%) Average 25 50 350 77.51 ± 2.18 85.24 ± 3.28 76.39 ± 1.28 79.71 ± 4.66a 450 74.28 ± 0.55 84.62 ± 1.64 85.53 ± 2.39 81.48 ± 5.61b 500 85.92 ± 2.71 84.59 ± 1.89 87.05 ± 1.16 85.86 ± 2.05c Average 79.24 ± 6.01a 84.82 ± 0.37c 82.99± 5.76b
Table 7. Effect of bioslurry as nutrient solution and seed density
- n in vitro DM digestibility (%) of corn GHF
SLIDE 11 30/ 11/ 2016 11
Seed Density (g/ tray)
Bioslurry Percentage (%) Average 25 50
350
160.51 ± 27.91 147.96 ± 21.48 131.38 ± 32.16 146.62 ± 27.00
450
152.41 ± 23.94 132.44 ±32.39 130.91 ± 25.08 138.59 ± 25.90
500
193.81 ± 74.90 153.79 ± 16.84 167.73 ± 94.24 171.78 ± 63.27 Average 168.91 ± 21.94 144.73 ± 11.03 143.34 ± 21.12
Table 8. Effect of bioslurry as nutrient solution and seed density
- n VFA concentration (mM ) of corn GHF
TOTAL VFA CONCENTRATION NH3 CONCENTRATION
Seed Density (g/ tray)
Bioslurry Percentage (%) Average 25 50
350 5.29 ± 0.37 4.23 ± 0.24 4.82 ± 0.46 4.78 ± 0.56 450 5.19 ± 0.99 5.21 ± 2.78 5.57 ± 2.37 5.32 ± 1.90 500 3.79 ± 0.22 4.70 ± 0.36 4.39 ± 2.23 4.29 ± 1.20 Average 4.76 ± 0.84 4.71 ± 0.49 4.93 ± 0.59
Table 9. Effect of bioslurry as nutrient solution and seed density
- n NH3 concentration (mM ) of corn GHF
SLIDE 12 30/ 11/ 2016 12
CONCLUSIONS
GHF increased CP content of corn grain from 8% to 14%,
without significant CF change.
The application of 25% bioslurry as nutrient source and
medium seed density (45 g/ 100 cm2) produced highest corn GHF yield and higher digestibility.
FUNDING SUPPORTED BY:
SNV – The Netherland IPB Strategic Research 2013
Green house fodder pilot project in KPSBU Lembang-Bandung
SLIDE 13
30/ 11/ 2016 13
THANK YOU