
SLIDE 1
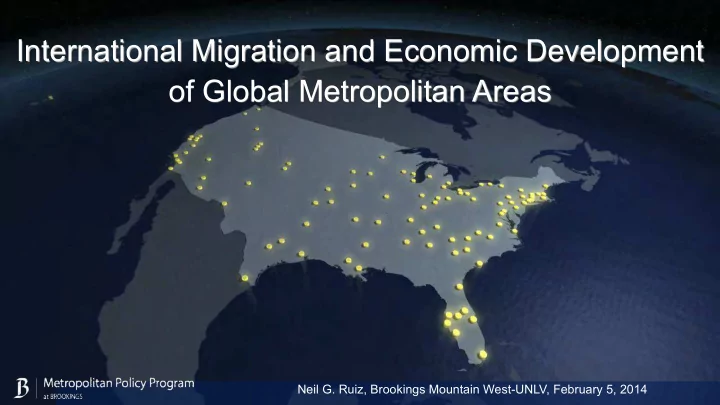
International Migration and Economic Development
- f Global Metropolitan Areas
Neil G. Ruiz, Brookings Mountain West-UNLV, February 5, 2014
International Migration and Economic Development of Global - - PowerPoint PPT Presentation
International Migration and Economic Development of Global Metropolitan Areas Neil G. Ruiz, Brookings Mountain West-UNLV, February 5, 2014 A skilled workforce provides the foundation for metropolitan areas to transition to the Next Economy
Neil G. Ruiz, Brookings Mountain West-UNLV, February 5, 2014
The H-1B Program connects US employers to high-skilled workers
Share of Global Engineering BAs
Asia
Europe
United States
Source: National Science Foundation, Science and Engineering Indicators (2012)
Private Firms
Capped
Research, Non-Profit, Government Organizations
Uncapped
Private Firms
Capped
115,000 195,000 65,000 85,000
H-1B Cap
For Private Employers
Information Technology Management Consulting Manufacturing Finance
Research, Non-Profit, Government Organizations
Uncapped
Source: Brookings Analysis of USCIS Characteristics of H-1B Speciality Occupation Workers (2012)
India
China
United Kingdom
Canada
South Korea
Philippines
Metros drive demand for H-1B workers
Metro Profiles
Rochester, MN San Jose Columbus, IN
Metro Profile
San Jose, CA
San Jose
STEM
Computer Occupations Engineers Business Operations Specialists
H-1B visa requests
H-1B intensity
requests per 1,000 workers
Occupations Top Employers Requesting H-1Bs
Uncapped
Applications
Metro Profile
Columbus, IN
Columbus, IN
STEM
Occupations Computer Occupations Engineers
H-1B visa requests
H-1B intensity
requests per 1,000 workers
Applications Top Employers Requesting H-1Bs
Uncapped
Metro Profile
Rochester, MN
Rochester, MN
STEM
Occupations Health Practitioners Life Scientists
H-1B visa requests
H-1B intensity
requests per 1,000 workers
Applications Top Employers Requesting H-1Bs
Uncapped
Metro H-1B Data Profiles
106 High-Demand Metros
Metros need skills training
technical skills training and STEM education, 2001-2011
Employment and Training Administration Department of Labor National Science Foundation
Employment & Training Administration Department of Labor
Federal Government Target skills training in high H-1B demand metros Metro Leaders Collaborate to apply for H-1B technical skill grants
Metros are home to foreign students
Forthcoming Brookings Report on Foreign Students
most common visa
purposes, also known as the Fulbright Program
purposes only; least common visa
Foreign Students from Asia are driving growth
Smaller metros have the highest concentration of foreign students
Students from Asia comprise an overwhelming share of all foreign students studying STEM
US Metro Foreign Student Data Profiles
118 Highest US Metro Destinations of Foreign Students
4
All of the target industries have a significant STEM orientation
Metro Profile: Demand for H-1B Workers
Las Vegas, NV
Las Vegas
STEM
Computer Occupations Engineers Business Operations Specialists
H-1B visa requests
H-1B intensity
requests per 1,000 workers
Occupations Top Employers Requesting H-1Bs
Uncapped
Applications Health Practitioners
High-Demand H-1B Metros
$3.09
Low-Demand H-1B Metros
$15.26
Technical Skills Training
Per-Capita Expenditures
Las Vegas
$0.28
Metro Profile: Supply of Foreign Students
Las Vegas, NV
F-1 Students 2,850 15.4 F-1 Visas Intensity Approved Top Schools 12.1% STEM Business, Management, Marketing 1,876 Engineering 157 Basic Skills and Remedial Education 136 Health Professions 121 Computer and Information Sciences 74 Top Global Hometowns Seoul 455 Singapore 263 Hong Kong 83 Beijing 57 Busan 55 Las Vegas
1.
Demand for STEM H-1B Workers (50 percent of all requests)
2.
Only 12 percent of Foreign Students in STEM fields
3.
Large majority of Foreign students in Business (66 percent of all F-1 students)
4.
Las Vegas is connected with Seoul, Singapore, and Hong Kong through Foreign Students
5.
Las Vegas should apply for H-1B visa fee funded workforce training grants in STEM
Neil G. Ruiz, Brookings Mountain West-UNLV The Lincy Institute, February 5, 2014