
SLIDE 1
International Conference on Challenges of the Anthropocene (ICCA), 10-12 May 2017
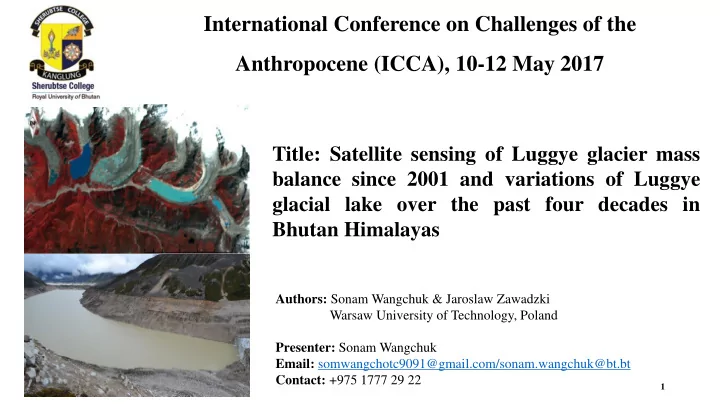
Title: Satellite sensing of Luggye glacier mass balance since 2001 and variations of Luggye glacial lake over the past four decades in Bhutan Himalayas
Authors: Sonam Wangchuk & Jaroslaw Zawadzki Warsaw University of Technology, Poland Presenter: Sonam Wangchuk Email: somwangchotc9091@gmail.com/sonam.wangchuk@bt.bt Contact: +975 1777 29 22
1