
SLIDE 1
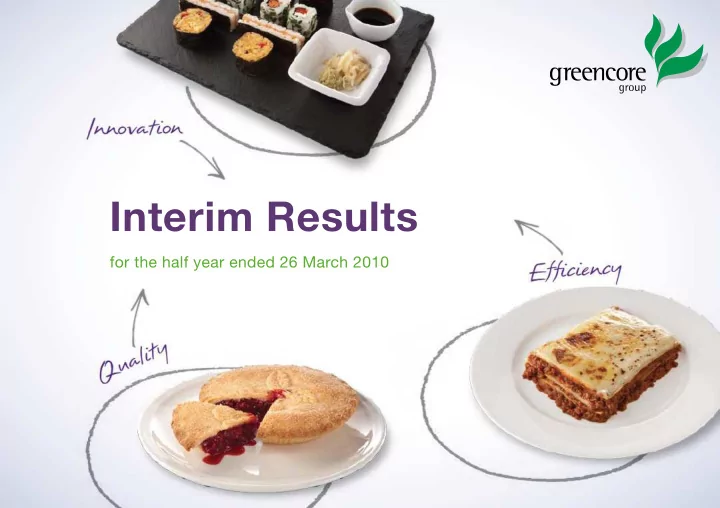
Interim Results
for the half year ended 26 March 2010
Interim Results for the half year ended 26 March 2010 2010 interim - - PowerPoint PPT Presentation
Interim Results for the half year ended 26 March 2010 2010 interim highlights Highlights Patrick Coveney, CEO Financial Review Geoff Doherty, CFO Operating Review Patrick Coveney, CEO Outlook Patrick Coveney, CEO Q & A Open to the
for the half year ended 26 March 2010
2
Convenience Foods
delivery underpinning strong sales and margin performance across portfolio
investment in Greencore USA
+43.0%
+14.9%
€194.2m
* on continuing basis
3
Geoff Doherty Chief Financial Offjcer
4
Revenue Revenue Operating profjt* Operating profjt* Operating margin* Operating margin* Effective tax rate Effective tax rate Adjusted EPS** Adjusted EPS** €434.5m €434.5m
Versus H1 FY09 Versus H1 FY09
€27.7m €27.7m 6.4% 6.4% 18% 18% 8.5c 8.5c
+2.1% +2.1% +190bps +190bps +2% +2% +14.9% +14.9%
Net debt Net debt
+43% +43%
* before exceptional items and acquisition related amortisation ** before exceptional items, acquisition related amortisation, pension fjnancing, change in the fair value of derivatives and FX effects
€194.2m €194.2m
5
than price led
margin driven by volume, effjciency and productivity gains
€m H1 FY10 H1 FY09 %Change Revenue 397.0 374.0 +6% Operating profjt* 25.9 19.6 +32% Margin 6.5% 5.2%
€m H1 FY10 H1 FY09 %Change Revenue 10.0 11.8
Operating loss* (1.3) (0.1) Continuing Discontinued
* before exceptional items and acquisition related amortisation
6
consideration of up to €116m
sales and operating profjt
indicative of malt earnings returning to lower point of cycle
€m H1 FY10 H1 FY09 %Change Revenue 90.6 112.9
Operating profjt* 9.6 11.7
Margin 10.5% 10.4% Discontinued
* before exceptional items and acquisition related amortisation
7
€m H1 FY10 H1 FY09 % Change Revenue 37.5 51.4
Operating profjt/(loss)* 1.8 (0.3)
Continuing
Group, post Malt
and surplus property trading
by modest improvement in property disposal activity and reduced divisional costs
* before exceptional items and acquisition related amortisation
8
€m
H1 FY10 H1 FY09
Interest (13.9) (12.3) Unwind discount to present value (0.1) (0.1) Finance cost* (14.0) (12.4) Pension (charge)/credit (0.1) 0.6 FX/fair value of derivatives
(0.9) (22.2)
Net fjnance
(15.0) (34.0)
* before fair value and pensions
9
H1 FY10 exceptionals €m
Profjt/(Loss)* H1 Cash impact*
Malt disposal 18.5 93.6 Water disposal
(2.7)
14.1 Net increase in equity / cash 15.8 107.7 Recycling of FX** (7.3) n/a Net profjt / cash 8.5 107.7
* Subject to adjustment in H2 in respect of completion accounts and costs ** No impact on equity
10
€cent
H1 FY10 H1 FY09
Adjusted EPS 8.5 7.4 Dividend per share Interim proposed 3.0 3.0
to be within the 40 - 50% policy range
11
March 2010 March 2009
% Change
Group net assets (€m)
199.5 144.6 +38%
Net debt: EDITDA (times)
2.30 3.35
‘hits’
12
H1 FY10 H1 FY09 EBITDA - continuing 38.3 30.0 Movement in working capital - continuing 3.8 (15.0) Payments into pension plans (net) (2.9) (2.5) Finance costs (net) (14.1) (13.6) Operating cashfmow 25.1 (1.1) Capital expenditure (14.0) (13.1) Free cashfmow 11.1
(14.2)
Closing net debt 194.2m 332.6m
13
defjcit
arrangements
with effect from 31 December 2009
scheme defjcits
higher than the €8.5m reported in FY09
management options
* net of deferred taxation
75.5 69.3 84.1
€m
FY09 H1FY10 H1FY09
Pension defjcit 14
14.8% 15.2% 14.1%
ROCE %
FY09 H1FY10 H1FY09
* calculated as total operating profjt based on a 12 month rolling basis
15
16
Patrick Coveney Chief Executive Offjcer
17
Excellent performance across Convenience Foods business
Portfolio focused on Convenience Foods Sustained growth and investment in Greencore USA
18
complete
US business
aspects of strategic, operational and commercial delivery
19
Continuing business
+6.1%
+130bps
20
convenience
and ‘out of town’ formats
innovation’ sustaining volumes - both are here to stay
6.9% 7.3% 5.4% 24wk 12wk 52wk Accelerating market growth*
*Source: Kantar Worldpanel to 21 March 2010 , Nielsen EPOS data & sales estimates Market defjned as sandwiches, salads, sushi, chilled ready meals, quiche, celebration cakes, Christmas cakes, chilled desserts (hot eat), cheesecakes, cooking sauces, pickles and frozen Yorkshire puddings
21
*Source: Greencore estimate
Ready meals market
landscape
capacity removed*
Food to Go market
market
and/or deployed
industry capacity removed*
Impact
curtailed capacity additions
absorbed much of the available marginal capacity
22
+5.5% +7.0%
Market growth
Sandwiches
Greencore growth
+8.5% +25.5%
Market growth
Chilled ready meals
Greencore growth
*Source: Kantar Worldpanel 24 w/e 21 March 2010 , Nielsen EPOS data & sales estimates (value growth)
position
expansion and new delivery formats
model
meal performance
Italian business secured
23
management team taking 5% pay cut
positive impact
contribution from new business wins to fall to the ‘bottom line’
performance culture coming through
enhancement capex
Productivity gains Operational leverage Benefjt of FY09 effjciency initiatives
24
underlying sales 27% ahead of the previous year
with fresh manufactured sandwiches replacing ‘made in store’ lines at two core customers
customers but also commenced trading with several signifjcant new players
enhance capacity by up to 50% and upgrade infrastructure at a total cost of c. $5m
being embedded in the business
25
fjrst half of FY10
in FY10 in Convenience Foods
Malt and Water disposals
approximately 16.0 cent for FY10
*Before exceptional items, acquisition related amortisation, pension fjnancing, change in the fair value of derivatives and FX effects
26
27