
SLIDE 1
1
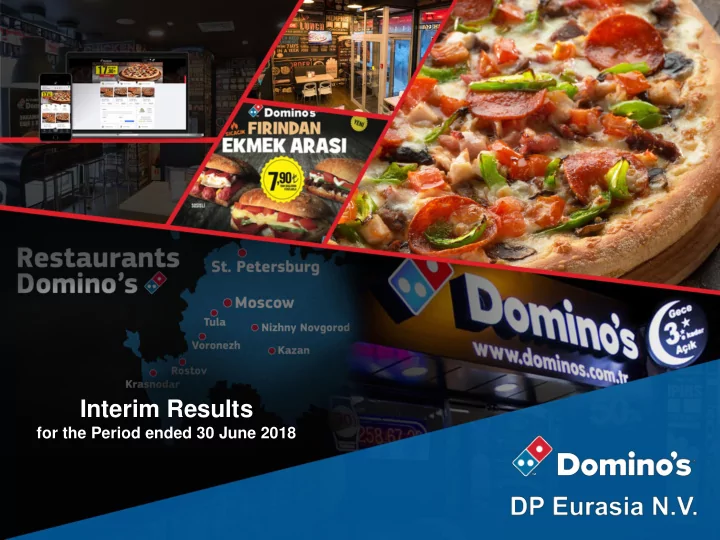
Interim Results for the Period ended 30 June 2018 1 Disclaimer - - PowerPoint PPT Presentation
Interim Results for the Period ended 30 June 2018 1 Disclaimer This Presentation is not an offer to buy or sell any securities. Save where otherwise indicated, the Company is the source of the content of this Presentation and, accordingly,
1
2
This Presentation is not an offer to buy or sell any securities. Save where otherwise indicated, the Company is the source of the content of this Presentation and, accordingly, although care has been taken to ensure that the facts stated in this Presentation are accurate and that the opinions expressed are fair and reasonable, no representation, warranty or undertaking, express or implied, is made by any of the Company, any of its directors, officers, employees, affiliates, advisors, shareholders or representatives as to, and no reliance should be placed on, the fairness, accuracy, completeness or correctness of the information or the opinions contained herein. Neither the Company nor any of its directors, officers, employees, affiliates, advisors or representatives shall have any liability whatsoever (in negligence or otherwise) for any loss howsoever arising from any use of this Presentation or its contents
Certain statements in this Presentation are not historical facts and are “forward looking” statements. These forward-looking statements can be identified by the use of forward-looking terminology, including the terms “believes”, “estimates”, “anticipates”, “expects”, “intends”, “plans”, “may”, “will” or “should” or, in each case, their negative or other variations or comparable terminology. None of the Company, its directors, officers, employees, affiliates, advisors, shareholders or representatives intend or have any duty or obligation to supplement, amend, update or revise any of the forward-looking statements contained in this Presentation or to update or to keep current any other information contained in this Presentation. The information and opinions contained in this Presentation are provided as at the date of this Presentation and are subject to change without notice. As a result, you are cautioned not to place undue reliance on such forward looking statements.
3
SECTION 1:
5
Source: Company Information
6
(2017 H1: 6.9%)
(2017 H1: 31.3%) LIKE-FOR-LIKE GROWTH 32.2% REVENUE
(2017 H1: 287.7m) STORE COUNT SYSTEM SALES Adjusted EBITDA
(2017 H1: 398.5m) TRY 40.3m
(2017 H1: 37.3m)
8.0%
(2017 H1: 49.7%) 28.1% ONLINE DELIVERY 79
(2017 H1: 593) 9.6% points TRY 36.5m
(2017 H1: 32.5m)
TRY 7.4m
(2017 H1: 4.9m)
12.1% 49.2%
SECTION 2:
8
Source: Company Information
in August 2018, Russia to follow
development process of digital solutions in Turkey and deliver to other countries concurrently
technology trends and design trends – focused on best customer experience
stores in Turkey, to be launched in early 2019
increased delivered
engagement – real time order progression
speeding and harsh brake reporting
sandwich order mix at 13% in H1 2018 without cannibalisation
from Turkey to Russia, e.g. ultra- thin crust and mosaic cake
Turkey in November’17
15% increase in app frequency
9
33% 7% 43% 11% Online Total
2017 H1 2018 H1
85% 31% 53% 18% Online Total
2017 H1 2018 H1
Lfl performance continues to be strong...
System sales Lfl growth, %
Russia Turkey
57% 152% 2017 H1 2018 H1 26% 406% 2017 H1 2018 H1
...with the revamped apps leading the charge
App System sales Lfl growth, %
Russia Turkey
10
63% 42% 74% 52% Delivery Total
2017 H1 2018 H1
46% 30% 54% 39% Delivery Total
2017 H1 2018 H1
2017 H1 2018 H1
Share of online ordering growing healthily
Online system sales, %
Russia Turkey Group
Source: Company Information
11
…with Russia heading to 200th store
# of stores at period end
Turkey moving towards 550 stores...
# of stores at period end (1) # of stores at period end
Continuous and significant store rollout
Source: Company Information Source: Company Information
469 497 530 450 550 2016 H1 2017 H1 2018 H1 45 96 142 50 100 150 2016 H1 2017 H1 2018 H1 +33 +51 +46
370 432 466 495 522 497 530 13 19 43 72 121 96 142 80 103 130 160 219 289 383 451 509 567 643 593 672 2007 2008 2009 2010 2011 2012 2013 2014 2015 2016 2017 2017 H1 2018 H1 +23 +27 +30 +59 +70 +94 +68 +58 +58 +76 DP Russia DP Turkey
Source: Company Information
+28
Notes:
+79
12
strategy in Moscow, we are continuing to expand, further building upon our growing market presence
shows very high demand and still has high potential for further growth
‒
8 new cities: St. Petersburg, Krasnodar, Rostov-on-Don, Tver, Nizhny Novgorod, Tula, Voronezh, Kazan
‒
New cities have a population of more than 1 million people; reachable from Moscow, which provides convenient delivery from commissary
‒
Continuing planned roll out to further cities
H1 2017.
Progress in Greater Moscow has been rapid Expansion outside of Greater Moscow progressing well
European part of Russia 43 72 116 129 42 52 70 84 13 37 61 74 2015 2016 2017 2018 H1 DPEU Papa John's Dodo
Krasnodar - 4 Franchise Stores Kazan - 1 Franchise Store Nizhny Novgorod - 1 Franchise Store Rostov-on-Don - 1 Franchise Store Voronezh - 1 Franchise Store Tula - 1 Franchise Store Tver - 1 Franchise Store
Petersburg (4) Tver’ (1) Kazan (1) Nizhny Novgorod (1) Tula (1) Voronezh (1) Rostov-on-Don (1) Krasnodar (4) Moscow
SECTION 3:
14
37 40 2017 H1 2018 H1 399 510 2017 H1 2018 H1 Year on year growth 223 246 370 426 593 672 2017 H1 2018 H1 Corporate Franchise
System Sales, TRY MM
30 33 20% 17% 2017 H1 2018 H1 Capex Cash Conversion
TRY MM %
62% 38%
# of Outlets
28%
TRY MM
Growth in system sales supported by store roll-out Adjusted EBITDA with margin a function of sales mix effect Capex and cash conversion(2)
Source: IFRS Combined and Consolidated Financial Information, Management Accounts Notes:
9.4%
7.9% 63% 37%
15
33 36 2017 H1 2018 H1 308 358 2017 H1 2018 H1 Year on year growth 135 145 355 376 490 521 2017 H1 2018 H1 Corporate Franchise
System Sales, TRY MM TRY MM %
72% 28%
# of Outlets
16%
TRY MM
System Sales Adjusted EBITDA and margin Capex and cash conversion(4)
Source: IFRS Combined and Consolidated Financial Information, Management Accounts Notes:
10.6%
10.2% 72% 28%
Store count(2)
11 21 66% 43% 2017 H1 2018 H1 Capex Cash Conversion
16
5 7 2017 H1 2018 H1 91 153 2017 H1 2018 H1 Year on year growth 88 101 8 41 96 142 2017 H1 2018 H1 Corporate Franchise
System Sales, TRY MM TRY MM # of Outlets
69%
TRY MM
System Sales Adjusted EBITDA and margin Capex
Source: IFRS Combined and Consolidated Financial Information, Management Accounts Notes:
5.4%
4.8% 29% 71%
Store count
19 13 2017 H1 2018 H1 8% 92%
17
Notes:
collection/payment day coinciding on a weekend
37 40 (30) (33) 7 7 2017 H1 2018 H1
Capex
Cash Conversion 107 150 121 134 228 284 1.1x 1.6x 2017 2018 H1
Gross Debt
TRY MM TRY MM
Cash flow generation 2018 H1 adjusted net debt by currency Post Rouble Refinancing adjusted net debt by currency(3)
Source: IFRS Combined and Consolidated Financial Information
Debt profile of DP Eurasia
20% 17%
(1)
(2) (1) (2)
38% 56% 6% TRY EUR RUB 14% 86% TRY RUB
18
Total potential store count Targeted net store
(medium term) LfL (medium term) CAPEX program
new store openings
main drivers of new store openings
SECTION 4:
20
Source: Company Information
SECTION 5:
22
Innovation and online ordering to drive like-for-like growth
Source: Company information
Potential to export the platform Large whitespace opportunity in countries of presence
Domino’s stores, #
Source: Company estimates Notes:
Russia Adj. EBITDA / System Sales, %
Source: Company information
Leverage scale advantage to further improve profitability
System sales LfL growth, % 33% 7% 43% 11% Online Total 85% 31% 53% 18% Online Total
Turkey Russia 2017 H1 2018 H1
2018 H1 Total Potential 521
2018 H1 Total Potential 142
DP Russia DP Turkey
(1)
Turkey Adj. EBITDA / System Sales, % DP Eurasia
1 2 3 4
5.4% 4.8% 2017 H1 2018 H1 10.6% 10.2% 2017 H1 2018 H1
23
Leading market positions
1
Highly attractive, underpenetrated markets with substantial growth potential in the Group’s addressable segments
2
Strong online capabilities underpin DP Eurasia’s growth
3
Globally proven business model successfully applied and adapted to DP Eurasia’s local markets
4
Simple and scalable, asset-light business model
5
Track record of resilient and profitable growth as well as strong cash conversion
7
Founder-led, experienced management team
8
Highly attractive customer proposition and strong brand equity
6
24
Key KPIs DP Eurasia income statement
System sales
(both corporate and franchise) Corporate revenue
Franchise revenue and royalty
franchise stores and royalties calculated based on franchise store sales to customers, including the contribution to national advertising Cost of sales
the Group’s commissaries, such as merchandise and raw materials; ingredients and non-food items (including those sold to the Group’s sub- franchisees); labour; rent; utilities and other, including D&A of corporate stores and commissaries General and administrative expenses
personnel (excl. marketing and selling personnel), rent, utilities, commissaries’ rents and non- production related personnel and headquarters- related D&A expenses Marketing and selling expenses
royalties paid by the Group (on-going fees) and promotion and advertising expenses
Source: Company Information, IFRS Combined and Consolidated Financial Information, Management Accounts Notes:
(TRY MM) 2018 H1 2017 H1 Change Revenue 380.2 287.7 32.2% Cost of Sales (251.8) (184.7) 36.3% Gross Profit 128.5 103.0 24.8% General Administrative Expenses (63.0) (44.2) 42.4% Marketing and Selling Expenses (50.0) (41.3) 21.0% Other Operating Income / (Expense) (0.6) (0.9) n.m. Operating Profit 14.9 16.5
Foreign Exchange (losses)/gains (8.6) (7.3) n/a Financial Income 0.5 0.4 n/a Financial Expense (16.8) (10.0) 68.8% Profit / (Loss) Before Tax (10.0) (0.4) n/a Tax Expense (0.3) (3.4)
Net Income (10.4) (3.8) n/a Adjusted EBITDA 40.3 37.3 8.0% Adjusted net income (9.1) (2.4) n/a
2018 H1 2017 H1 Change Corporate Store Count 246 223 23 Franchise Store Count 426 370 56 System sales (TRY MM) 510.4 398.5 28.1%
25
Notes:
(TRY MM) 2018H1 2017H1 Change 2018H1 2017H1 System sales 510.4 398.5 28% Corporate 222.3 173.8 28% as a % of system sales 43.5% 43.6% Franchise 288.2 224.6 28% as a % of system sales 56.5% 56.4% 2018H1 2017H1 Change 2018H1 2017H1 Revenue 380.2 287.7 32% Corporate 222.3 173.8 28% as a % of revenue 58.5% 60.4% Franchise 135.0 103.4 30% as a % of revenue 35.5% 36.0% Other revenue 23.0 10.4 121% as a % of revenue 6.0% 3.6% Cost of Sales (251.8) (184.7) 36% Cost of Food/Non-Food/Transportation (131.1) (100.5) 30% as a % of system sales 25.7% 25.2% Corporate Store Expenses (103.0) (70.5) 46% as a % of corporate system sales 46.3% 40.5% Depreciation and Amortization (17.7) (13.7) 30% as a % of system sales 3.5% 3.4% Gross Profit 128.5 103.0 25% as a % of system sales 25.2% 25.8% General Administrative Expenses (63.0) (44.2) 42% Overhead (Including Commisary) (55.3) (37.1) 49% as a % of system sales 10.8% 9.3% Depreciation and Amortization (6.4) (5.6) 15% Share based incentives (1.1) (0.1) n/a IPO Costs (0.2) (1.4) n/a Marketing and Selling Expenses (50.0) (41.3) 21% Marketing and Advertising (26.9) (23.0) 17% as a % of system sales 5.3% 5.8% Corporate Store Local Marketing (3.0) (2.5) 18% as a % of corporate system sales 1.3% 1.5% Royalty (20.1) (15.8) 28% as a % of system sales 3.9% 4.0% Other Operating Income / (Expense) (0.6) (0.9) n/a Operating Profit 14.9 16.6
26
DP Turkey DP Russia DP Eurasia
Notes:
(TRY MM) 2018 H1 2017 H1 System Sales 357.7 308.0 Revenue 228.3 197.3 Operating profit 22.1 18.9 D&A 14.0 13.5 EBITDA 36.1 32.4 Non-recurring (income)/expenses 0.4 0.1 Adjusted EBITDA 36.5 32.5 % of system sales 10.2% 10.6% Adjusted EBIT 22.4 19.0 % of system sales 6.3% 6.2% Capital expenditures 21.0 11.0 Cash conversion 42.5% 66.1% (TRY MM) 2018 H1 2017 H1 System Sales 152.7 90.5 Revenue 151.9 90.3 Operating profit (3.6) (0.9) D&A 10.1 5.8 EBITDA 6.5 4.9 Non-recurring (income)/expenses 0.8 0.0 Adjusted EBITDA 7.4 4.9 % of system sales 4.8% 5.4% Adjusted EBIT (2.8) (0.8) % of system sales
Capital expenditures 12.5 19.0 Cash conversion n.m. n.m. (TRY MM) 2018 H1 2017 H1 System Sales 510.4 398.5 Revenue 380.2 287.7 Operating profit 14.9 16.5 D&A 24.2 19.3 EBITDA 39.0 35.8 Non-recurring (income)/expenses 1.3 1.5 Adjusted EBITDA 40.3 37.3 % of system sales 7.9% 9.4% Adjusted EBIT 16.1 18.1 % of system sales 3.2% 4.5% Capital expenditures 33.5 30.0 Cash conversion 16.9% 19.5% (TRY MM) 2018 H1 2017 Short term bank borrow ings 224.4 136.9 Short-term portions of long-term financial lease borrow ings 6.5 5.2 Long-term bank borrow ings 42.0 74.5 Long-term financial lease borrow ings 10.9 11.2 Total borrow ings 283.8 227.9 Cash and cash equivalents (87.1) (76.1) Net debt 196.8 151.8 Non-recurring items Long term deposit for loan guarantee (33.2) (28.2) Adjusting delay in collection/payment day coinciding on a weekend (14.1) (16.8) Adjusted net debt 149.5 106.7
27
Period ended 30 June 2018 2017 Currency Period End Period Average Period End Period Average EUR/TRY 5.309 4.942 4.003 3.931 RUB/TRY 0.072 0.068 0.059 0.062 EUR/RUB 72.992 71.822 67.499 62.719
Source: Company Information
28
64% 63% 36% 37% 2017 H1 2018 H1 Delivery Take-away / Eat-in 64% 64% 36% 36% 2017 H1 2018 H1 Delivery Take-away/Eat-in 62% 62% 38% 38% 2017 H1 2018 H1 Delivery Take-away / Eat-in
% of system sales
Russia Turkey Group
Source: Company Information