
SLIDE 1
11/2/2016 1
Hosted By: Hosted By:
Intelligent Water Systems: A Smart Start
November 2, 2016 Moderated by: Fidan Karimova Water Technology Collaboration Manager Water Environment & Reuse Foundation
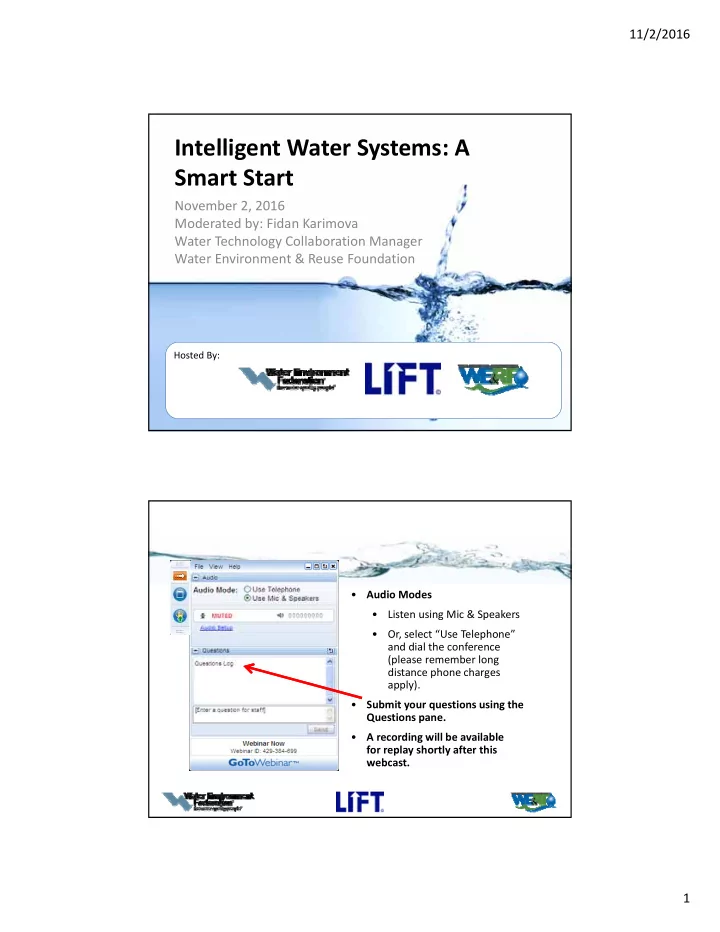
How to Participate Today
- Audio Modes
- Listen using Mic & Speakers
- Or, select “Use Telephone”
and dial the conference (please remember long distance phone charges apply).
- Submit your questions using the
Questions pane.
- A recording will be available
for replay shortly after this webcast.