ING Office Fund Acquisition of the Homer Building, Washington DC - - PowerPoint PPT Presentation
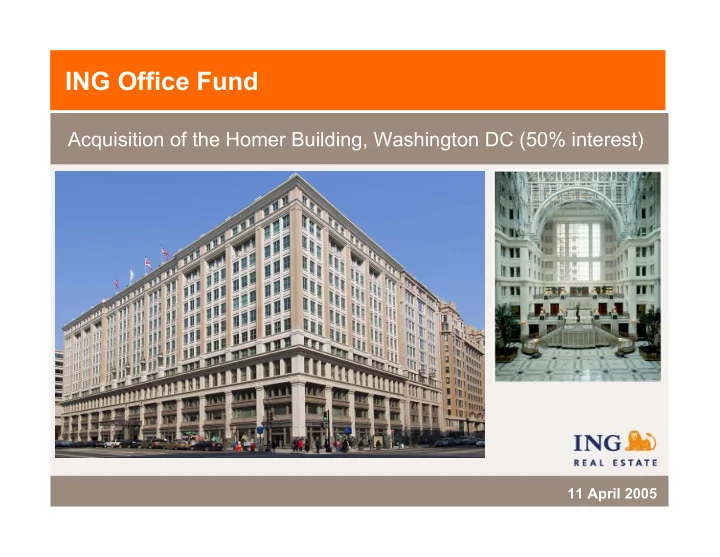
ING Office Fund Acquisition of the Homer Building, Washington DC (50% interest) 11 April 2005 Transaction summary Key benefits One of Washington DCs most prominent and finest office buildings Outstanding location - 3 blocks from the
Transaction summary
One of Washington DC’s most prominent and finest office buildings Outstanding location
- 3 blocks from the White House and National Mall
- situated over Metro Centre (major rail commuter hub)
- within retail and entertainment precinct
Improves the Fund’s earnings Increases the Fund’s weighting to Washington DC Offers value add / leasing opportunity in short term Attractive guaranteed initial yield with solid growth prospects
Key benefits
2
Transaction summary
Property details
Location: 601 13th Street, Washington DC Interest: 50% (leasehold) Ground lease: 99 years Appraisal (100%): USD 210.0m ($501sqf) Minimum year 1 yield*: 6.5% Under-renting: 6% Occupancy: 100%
* Guaranteed minimum NOI yield of 6.5% for years 1 - 3
3
The Homer Building
Skylight twelve-storey atrium Tenancy foyer
4
The Homer Building
Property details
Type: Class A office Tenants: 26 office tenancies & 6 retail tenancies Average lease expiry: 3.7 years Net rentable area: 418,373sqf Land area: 43,243sqf (0.99 acres) Height: 12 storeys Average office floor size: 38,000sqf Parking: 282 undercover
5
The Homer Building
Dallas New York Washington DC
Location
Existing IOF Assets Homer Building
6
The Homer Building
Location
Approx 3 blocks from White House Situated above Metro Centre High profile East End location Strong gov’t presence Retail and entertainment precinct Consistently high occupancy
Homer Building
White House
7
Washington DC office market
Summary and outlook
Strong barriers to entry and planning restrictions limit new supply Net absorption of 4.6msqf in 2003 increased to 10.3msqf in 2004 Unemployment rate of 3.2% among the lowest in the US Consistent office employment growth forecast at 2.0% p.a. for next 5 years Current vacancy rate of 10.3% forecast to fall to 6.6% by 2009 Strong consensus forecast rental growth for next 5 years
Source: Torto Wheaton, Economy.com, ING Real Estate
8
The Transaction
Acquisition funding (50%)
2.50m Acquisition costs 137.50m Property purchase price Application of funds AUD* 87.19m 52.81m Source of funds Existing property level debt New entity level debt
140.0m 140.0m
* AUD/USD spot = 0.765
40.4m USD 66.7m
107.1m 107.10m
105.19m 1.91m
9
Portfolio Impact
Geographic diversification
QLD 13% NSW 45% ACT 5% WA 2% NY 8% Washington DC 7% Dallas 4% VIC 16% QLD 12% NSW 41% ACT 5% WA 2% NY 8% Washington DC 13% Dallas 4% VIC 15%
Pre transaction Post transaction
10
Fund Impact
Balance sheet and gearing (look through)
31 Dec 04 Proforma AUD AUD* Total Australian assets $1,510.7m $1,510.7m Total US assets $335.4m $475.4m Total assets $1,846.1m $1,986.1m Total entity AUD denominated debt $338.2m $338.2m Total entity USD denominated debt $119.2m $172.0m Total USD property level debt $222.6m $309.8m Total debt $680.0m $820.0m Gearing ratio (look through) 36.8% 41.3%**
** DRP to be introduced from Jun-05 quarter * USD/AUD spot = 0.765
11
Impact on Fund
FX and interest rate hedging for acquisition
Amount USD Rate Duration Property level USD debt 100% 3.6% 2.2 years Entity level USD debt 100% 5.3% 5.0 years USD income hedge* 100% 0.726c 5.0 years
* USD/AUD spot = 0.765 Indicative rates only. Include margins.
12
Summary
EPU accretive from year 1 Premier asset in outstanding location and office market
- 3 blocks from the White House and National Mall
- desirable East End sub market
Enhances and complements existing portfolio
- strong prospects for growth
- opportunity for value add