
SLIDE 1
Information provided by
JACKSONVILLE STATE UNIVERSITY
Center for Economic Development and Business Research School of Business & Industry
Information provided by JACKSONVILLE STATE UNIVERSITY Center for - - PDF document
Information provided by JACKSONVILLE STATE UNIVERSITY Center for Economic Development and Business Research School of Business & Industry Connecting Our Greater Communities: Overview CEAZ Update (#2-#75) Mark Hearn - JSU SOBI
Information provided by
JACKSONVILLE STATE UNIVERSITY
Center for Economic Development and Business Research School of Business & Industry
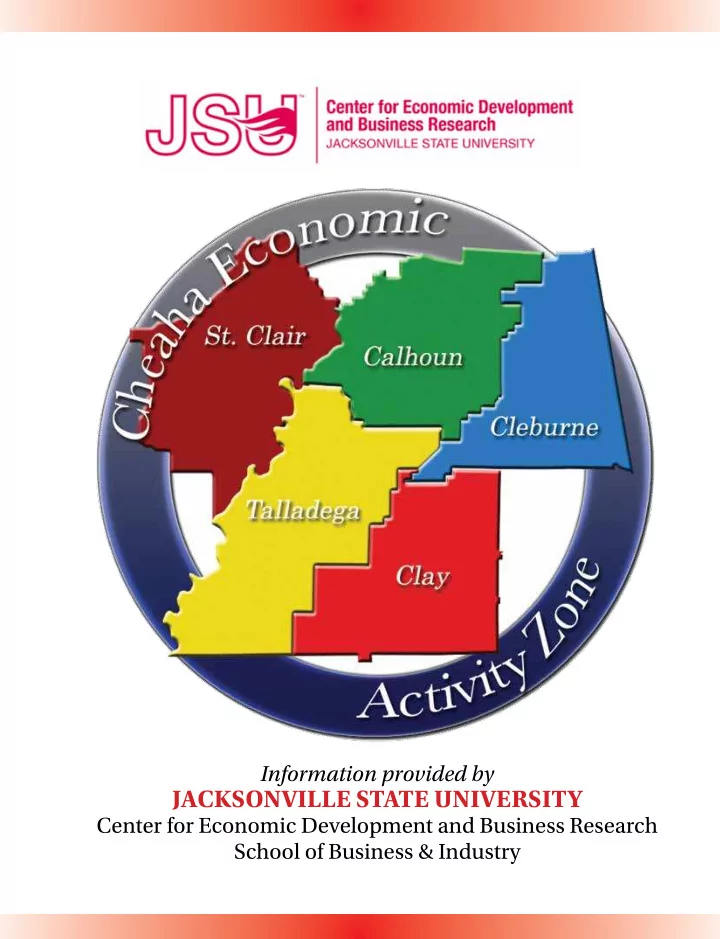
Cheaha Economic Activity Zone 4
1
Connecting Our Greater Communities: Overview
– Mark Hearn - JSU SOBI
– Richard Cobb - JSU SOBI
– Lesley McClure – Vice President and Regional Executive with Federal Reserve Bank of Atlanta, Birmingham Branch
CEAZ Members: Calhoun
2
Cheaha Economic Activity Zone 5
CEAZ Members: Clay
3
CEAZ Members: Cleburne
4
Cheaha Economic Activity Zone 6
5
CEAZ Members:
CEAZ Members: Talladega
6
Cheaha Economic Activity Zone 7
Economic Outlook Surveys for United States and Alabama
7
United States Alabama
U.S. Consumer Sentiment Jan 2013 – July 2017 (Prelim)
Source: University of Michigan Institute of Social Research
70 80 90 100 Jan-13 Jan-14 Jan-15 Jan-16 Jan-17
Last 12 Months +3.44%
8
Cheaha Economic Activity Zone 8
Business and Economic Research
9
0.6% 6.4% 33.3% 55.0% 4.7% 0% 10% 20% 30% 40% 50% 60% 70% Much Worse Worse Remain Same Better Much Better % of Respondents
Overall Economic Outlook for AL Q2 17 vs to Q3 17
Source: Alabama Business Leaders Confidence Index 10
Cheaha Economic Activity Zone 9
57.6 54.8 51.2 53.0 55.1 52.4 52.6 62.7 65.2 61.6 45 50 55 60 65 70 Q2 15 Q3 15 Q4 15 Q1 16 Q2 16 Q3 16 Q4 16 Q1 17 Q2 17 Q3 17 Index Value
Overall Economic Outlook Index AL Q2 15 – Q3 17
Source: Alabama Business Leaders Confidence Index 11
Q3 17 Index Down 3.6 pts
Hiring Outlook AL Q2 17 vs Q3 17
1.8% 6.4% 49.1% 39.8% 2.9% 0% 15% 30% 45% 60% Strong Decrease Moderate Decrease No Change Moderate Increase Strong Increase % of Respondents
Source: Alabama Business Leaders Confidence Index 12
Cheaha Economic Activity Zone 10
56.8 52.8 51.6 53.8 54.3 50.2 51.9 57.6 60.7 58.9 45 50 55 60 65 Q2 15 Q3 15 Q4 15 Q1 16 Q2 16 Q3 16 Q4 16 Q1 17 Q2 17 Q3 17 Index Value
Hiring Outlook Index AL Q2 15 – Q3 17
Source: Alabama Business Leaders Confidence Index 13
Q3 17 Index Down 1.8 pts
Sales Outlook AL Q2 17 vs Q3 17
2.3% 8.8% 30.4% 53.2% 5.3% 0% 10% 20% 30% 40% 50% 60% 70% Strong Decrease Moderate Decrease No Change Moderate Increase Strong Increase % of Respondents
Source: Alabama Business Leaders Confidence Index 14
Cheaha Economic Activity Zone 11
62.3 58.4 53.1 55.2 60.1 54.9 55.9 63.4 67.2 62.6 45 50 55 60 65 70 Q2 15 Q3 15 Q4 15 Q1 16 Q2 16 Q3 16 Q4 16 Q1 17 Q2 17 Q3 17 Index Value
Sales Outlook Index AL Q2 15 – Q3 17
Source: Alabama Business Leaders Confidence Index 15
Q3 17 Index Down 4.6 pts
1.2% 5.8% 49.7% 39.2% 4.1% 0% 10% 20% 30% 40% 50% 60% 70% Strong Decrease Moderate Decrease No Change Moderate Increase Strong Increase % of Respondents
Source: Alabama Business Leaders Confidence Index
Capital Expenditures Outlook AL Q2 17 to Q3 17
16
Cheaha Economic Activity Zone 12
55.4 52.3 51.5 53.1 54.2 53.4 52.0 58.5 61.9 59.8 45 50 55 60 65 Q2 15 Q3 15 Q4 15 Q1 16 Q2 16 Q3 16 Q4 16 Q1 17 Q2 17 Q3 17 Index Value
Source: Alabama Business Leaders Confidence Index 17
Q3 17 Index Down 2.1 pts
Capital Expenditures Outlook Index AL Q2 15 – Q3 17 Cheaha Economic Activity Zone (CEAZ): Overview
(#19-#24)
(#34)
(#35-#74)
18
Cheaha Economic Activity Zone 13
Population Trends Calhoun County 2007-2016 in Thousands
112.8 113.4 114.1 118.4 117.8 117.3 116.7 115.9 115.6 114.6 110 112 114 116 118 120 07 08 09 10 11 12 13 14 15 16 In 1,000
Source: U.S. Census Bureau 19
Population Trends Clay County 2007-2016 in Thousands
13.8 13.8 13.6 13.9 13.7 13.4 13.5 13.6 13.6 13.5 13.3 13.5 13.7 13.9 14.1 07 08 09 10 11 12 13 14 15 16 In 1,000
Source: U.S. Census Bureau 20
Cheaha Economic Activity Zone 14
Population Trends Cleburne County 2007-2016 in Thousands
14.7 14.7 14.8 15.0 14.9 14.8 15.0 15.1 15.0 14.9 14.2 14.4 14.6 14.8 15.0 15.2 07 08 09 10 11 12 13 14 15 16 In 1,000
Source: U.S. Census Bureau 21
Population Trends St. Clair County 2007-2016 in Thousands
79.3 81.2 83.0 85.6 82.4 85.5 86.3 86.7 87.1 88.0 78 80 82 84 86 88 90 07 08 09 10 11 12 13 14 15 16 In 1,000
Source: U.S. Census Bureau 22
Cheaha Economic Activity Zone 15
Population Trends Talladega County 2007-2016 in Thousands
80.2 80.5 80.2 82.0 81.8 81.8 81.1 81.3 80.9 80.1 79 80 81 82 83 07 08 09 10 11 12 13 14 15 16 In 1,000
Source: U.S. Census Bureau 23
Population Trends CEAZ 2007-2016 in Thousands
301 304 306 315 311 313 313 313 312 311 290 300 310 320 07 08 09 10 11 12 13 14 15 16 In 1,000
Source: U.S. Census Bureau 24
Cheaha Economic Activity Zone 16
Per Capital Personal Income Calhoun County 2006-2015 in 1,000s
25 Source: Bureau of Economic Analysis
$28.3 $29.9 $30.7 $30.1 $30.7 $31.4 $31.7 $31.3 $32.4 $33.4 $26 $28 $30 $32 $34 06 07 08 09 10 11 12 13 14 15 In 1,000
Per Capital Personal Income Clay County 2006-2015 in 1,000s
26 Source: Bureau of Economic Analysis
$27.9 $28.1 $28.2 $28.3 $28.9 $28.4 $29.5 $30.5 $31.7 $33.0 $26 $28 $30 $32 $34 06 07 08 09 10 11 12 13 14 15 In 1,000
Cheaha Economic Activity Zone 17
Per Capital Personal Income Cleburne County 2006-2015 in 1,000s
27 Source: Bureau of Economic Analysis
$24.0 $24.7 $26.8 $26.4 $27.3 $27.9 $29.1 $29.9 $30.7 $31.2 $23 $25 $27 $29 $31 $33 06 07 08 09 10 11 12 13 14 15 In 1,000
Per Capital Personal Income
28 Source: Bureau of Economic Analysis
$28.3 $29.9 $30.7 $30.1 $30.7 $31.4 $31.7 $31.3 $32.4 $33.4 $26 $28 $30 $32 $34 06 07 08 09 10 11 12 13 14 15 In 1,000
Cheaha Economic Activity Zone 18
Per Capital Personal Income Talladega County 2006-2015 in 1,000s
29 Source: Bureau of Economic Analysis
$25.9 $26.4 $26.6 $26.6 $27.7 $28.7 $29.2 $29.6 $30.8 $31.8 $23 $25 $27 $29 $31 $33 06 07 08 09 10 11 12 13 14 15 In 1,000
Per Capital Personal Income CEAZ 2006-2015 in 1,000s
30 Source: Bureau of Economic Analysis
$26.9 $27.7 $28.6 $28.2 $28.8 $29.4 $30.3 $30.7 $31.8 $32.8 $26 $28 $30 $32 $34 06 07 08 09 10 11 12 13 14 15 In 1,000
Cheaha Economic Activity Zone 19
Per Capital Personal Income CEAZ as % of AL 2006-2015
31 Source: Bureau of Economic Analysis
85.8% 85.1% 85.5% 86.2% 85.5% 84.7% 85.4% 85.8% 86.2% 86.2% 84.0% 84.5% 85.0% 85.5% 86.0% 86.5% 06 07 08 09 10 11 12 13 14 15
% Change in Per Capital Personal Income CEAZ 05-06 -14-15
32 Source: Bureau of Economic Analysis
4.0% 5.8% 2.5%
1.9% 2.5% 0.9%
3.5% 3.0%
0% 2% 4% 6% 8% 05-06 06-07 07-08 08-09 09-10 10-11 11-12 12-13 13-14 14-15
Cheaha Economic Activity Zone 20
Ave Weekly Wages 2nd Qtr 2016 U.S. Avg - $989 AL Avg - $835
$649 – or lower $650 - $749 $750 - $849 $850 or higher
Source: US Bureau of Labor Statistics 33
$671 $714 $813 $619
$733
$848
State Sales Tax Collections CEAZ FY 08-09 – FY 15-16 in $ Millions
Source: AL Dept of Revenue
$43.07 $42.63 $47.35 $50.32 $52.32 $57.87 $58.69 $58.30 $40 $45 $50 $55 $60 08-09 09-10 10-11 11-12 12-13 13-14 14-15 15-16 In $ Millions
34
Cheaha Economic Activity Zone 21
Labor Force Calhoun County 2007-2016 in Thousands
54.9 54.6 53.9 51.6 51.3 49.6 48.3 47.3 46.0 45.8 40 44 48 52 56 07 08 09 10 11 12 13 14 15 16 In 1,000
Source: Department of Labor Statistics 35
Labor Force Calhoun County June 16 – June 17 in Thousands
46.1 45.9 45.8 45.6 45.9 45.7 45.7 45.6 45.8 45.8 45.7 45.6 45.8 45.2 45.6 46.0 46.4
Jun16 Jul Aug Sep Oct Nov Dec Jan17 Feb Mar Apr May Jun17
In 1,000
Source: Department of Labor Statistics 36
Cheaha Economic Activity Zone 22
Employment Calhoun County 2007-2016 in Thousands
52.7 51.5 47.9 45.7 46.0 45.3 44.0 43.5 42.8 42.7 40 42 44 46 48 50 52 54 07 08 09 10 11 12 13 14 15 16 In 1,000
Source: Department of Labor Statistics 37
Employment Calhoun County June 16 – June 17 in Thousands
42.8 42.8 42.7 42.5 42.7 42.8 42.6 42.2 42.7 43.1 43.4 43.4 43.1 41.5 42.0 42.5 43.0 43.5 44.0
Jun16 Jul Aug Sep Oct Nov Dec Jan17 Feb Mar Apr May Jun17
In 1,000
Source: Department of Labor Statistics 38
Cheaha Economic Activity Zone 23
39
Unemployment Rate Calhoun County vs Alabama 2007 – 2016
3.9% 5.7% 11.1% 11.4% 10.3% 8.9% 8.8% 8.0% 7.0% 6.7% 4.0% 5.7% 11.0% 10.5% 9.6% 8.0% 7.2% 6.8% 6.1% 6.0%
0.0% 2.0% 4.0% 6.0% 8.0% 10.0% 12.0% 07 08 09 10 11 12 13 14 15 16 Calhoun Alabama
Source: Department of Labor Statistics 40
Unemployment Rate Calhoun County vs Alabama June 2016 – June 2017
7.1% 6.8% 6.8% 6.8% 6.9% 6.3% 6.7% 7.5% 6.7% 6.0% 5.0% 4.8% 5.9% 6.3% 6.1% 6.2% 6.2% 6.2% 5.7% 5.9% 6.8% 6.1% 5.3% 4.4% 4.2% 5.2%
3% 4% 5% 6% 7% 8%
Jun16 Jul Aug Sep Oct Nov Dec Jan17 Feb Mar Apr May Jun17
Calhoun Alabama
Source: Department of Labor Statistics
Cheaha Economic Activity Zone 24
Labor Force Clay County 2007-2016 in Thousands
6.1 5.7 5.6 5.9 5.6 5.4 5.4 5.5 5.6 5.6 4.8 5.2 5.6 6.0 6.4 07 08 09 10 11 12 13 14 15 16 In 1,000
Source: Department of Labor Statistics 41
Labor Force Clay County June 16 – June 17 in Thousands
5.6 5.5 5.6 5.7 5.7 5.6 5.5 5.5 5.7 5.8 5.7 5.7 5.7 5.2 5.4 5.6 5.8
Jun16 Jul Aug Sep Oct Nov Dec Jan17 Feb Mar Apr May Jun17
In 1,000
Source: Department of Labor Statistics 42
Cheaha Economic Activity Zone 25
Employment Clay County 2007-2016 in Thousands
5.8 5.3 4.7 5.0 4.9 4.9 4.9 5.1 5.2 5.2 4.0 4.5 5.0 5.5 6.0 07 08 09 10 11 12 13 14 15 16 In 1,000
Source: Department of Labor Statistics 43
Employment Clay County June 16 – June 17 in Thousands
5.2 5.2 5.2 5.3 5.3 5.3 5.2 5.1 5.4 5.5 5.5 5.4 5.4 4.8 5.0 5.2 5.4 5.6
Jun16 Jul Aug Sep Oct Nov Dec Jan17 Feb Mar Apr May Jun17
In 1,000
Source: Department of Labor Statistics 44
Cheaha Economic Activity Zone 26
45
Unemployment Rate Clay County vs Alabama 2007 – 2016
5.5% 7.9% 16.7% 14.5% 11.8% 9.4% 8.4% 7.2% 6.1% 6.2% 4.0% 5.7% 11.0% 10.5% 9.6% 8.0% 7.2% 6.8% 6.1% 6.0%
1% 6% 11% 16% 21% 07 08 09 10 11 12 13 14 15 16 Clay Alabama
Source: Department of Labor Statistics 46
Unemployment Rate Clay County vs Alabama June 2016 – June 2017
7.1% 6.8% 6.8% 6.8% 6.9% 6.3% 6.7% 7.5% 6.7% 6.0% 5.0% 4.8% 5.1% 6.3% 6.1% 6.2% 6.2% 6.2% 5.7% 5.9% 6.8% 6.1% 5.3% 4.4% 4.2% 5.2%
3% 4% 5% 6% 7% 8%
Jun16 Jul Aug Sep Oct Nov Dec Jan17 Feb Mar Apr May Jun17
Clay Alabama
Source: Department of Labor Statistics
Cheaha Economic Activity Zone 27
Labor Force Cleburne County 2007-2016 in Thousands
6.5 6.6 6.5 6.0 5.9 5.8 5.8 5.9 5.7 5.8 5.2 5.6 6.0 6.4 6.8 07 08 09 10 11 12 13 14 15 16 In 1,000
Source: Department of Labor Statistics 47
Labor Force Cleburne County June 16 – June 17 in Thousands
5.8 5.9 5.9 6.0 6.0 5.9 5.9 5.8 5.9 6.0 6.0 5.9 5.9 5.6 5.7 5.8 5.9 6.0 6.1
Jun16 Jul Aug Sep Oct Nov Dec Jan17 Feb Mar Apr May Jun17
In 1,000
Source: Department of Labor Statistics 48
Cheaha Economic Activity Zone 28
Employment Cleburne County 2007-2016 in Thousands
6.2 6.2 5.9 5.4 5.4 5.4 5.4 5.5 5.4 5.5 4.8 5.2 5.6 6.0 6.4 07 08 09 10 11 12 13 14 15 16 In 1,000
Source: Department of Labor Statistics 49
Employment Cleburne County June 16 – June 17 in Thousands
5.4 5.5 5.5 5.6 5.6 5.6 5.5 5.4 5.6 5.7 5.7 5.7 5.6 5.1 5.2 5.3 5.4 5.5 5.6 5.7 5.8
Jun16 Jul Aug Sep Oct Nov Dec Jan17 Feb Mar Apr May Jun17
In 1,000
Source: Department of Labor Statistics 50
Cheaha Economic Activity Zone 29
51
Unemployment Rate Cleburne County vs Alabama 2007 – 2016
3.7% 5.1% 10.2% 10.0% 9.7% 8.2% 7.7% 6.6% 6.0% 6.1% 4.0% 5.7% 11.0% 10.5% 9.6% 8.0% 7.2% 6.8% 6.1% 6.0%
0.0% 2.0% 4.0% 6.0% 8.0% 10.0% 12.0% 07 08 09 10 11 12 13 14 15 16 Cleburne Alabama
Source: Department of Labor Statistics 52
Unemployment Rate Cleburne County vs Alabama June 2016 – June 2017
6.3% 6.3% 6.1% 6.0% 6.5% 5.6% 6.0% 7.2% 6.1% 5.2% 4.3% 4.2% 5.1% 6.3% 6.1% 6.2% 6.2% 6.2% 5.7% 5.9% 6.8% 6.1% 5.3% 4.4% 4.2% 5.2%
3% 4% 5% 6% 7% 8%
Jun16 Jul Aug Sep Oct Nov Dec Jan17 Feb Mar Apr May Jun17
Cleburne Alabama
Source: Department of Labor Statistics
Cheaha Economic Activity Zone 30
Labor Force St. Clair County 2007-2016 in Thousands
36.0 36.5 36.8 38.3 38.5 38.5 38.7 38.5 38.4 38.6 35 36 37 38 39 07 08 09 10 11 12 13 14 15 16 In 1,000
Source: Department of Labor Statistics 53
Labor Force St. Clair County June 16 – June 17 in Thousands
38.7 38.7 38.6 38.6 38.9 38.9 38.9 38.7 38.9 38.8 38.8 38.7 39.0 38.4 38.6 38.8 39.0
Jun16 Jul Aug Sep Oct Nov Dec Jan17 Feb Mar Apr May Jun17
In 1,000
Source: Department of Labor Statistics 54
Cheaha Economic Activity Zone 31
Employment St. Clair County 2007-2016 in Thousands
34.8 34.7 32.8 34.4 35.1 35.9 36.4 36.3 36.3 36.5 30 31 32 33 34 35 36 37 07 08 09 10 11 12 13 14 15 16 In 1,000
Source: Department of Labor Statistics 55
Employment St. Clair County June 16 – June 17 in Thousands
36.5 36.7 36.4 36.4 36.7 36.9 36.8 36.3 36.7 36.9 37.2 37.2 37.2 35.0 36.0 37.0 38.0
Jun16 Jul Aug Sep Oct Nov Dec Jan17 Feb Mar Apr May Jun17
In 1,000
Source: Department of Labor Statistics 56
Cheaha Economic Activity Zone 32
57
Unemployment Rate St. Clair County vs Alabama 2007 – 2016
3.4% 5.0% 10.9% 10.1% 8.8% 6.9% 6.1% 5.8% 5.3% 5.3% 4.0% 5.7% 11.0% 10.5% 9.6% 8.0% 7.2% 6.8% 6.1% 6.0%
0.0% 2.0% 4.0% 6.0% 8.0% 10.0% 12.0% 07 08 09 10 11 12 13 14 15 16
Alabama
Source: Department of Labor Statistics 58
Unemployment Rate St. Clair County vs Alabama June 2016 – June 2017
5.5% 5.3% 5.6% 5.6% 5.7% 5.1% 5.3% 5.3% 5.6% 4.9% 4.0% 3.8% 5.7% 6.3% 6.1% 6.2% 6.2% 6.2% 5.7% 5.9% 6.8% 6.1% 5.3% 4.4% 4.2% 5.2%
3% 4% 5% 6% 7%
Jun16 Jul Aug Sep Oct Nov Dec Jan17 Feb Mar Apr May Jun17
Alabama
Source: Department of Labor Statistics
Cheaha Economic Activity Zone 33
Labor Force Talladega County 2007-2016 in Thousands
38.9 38.3 37.8 35.1 35.3 35.0 35.7 35.4 35.2 34.8 32 34 36 38 40 07 08 09 10 11 12 13 14 15 16 In 1,000
Source: Department of Labor Statistics 59
Labor Force Talladega County June 16 – June 17 in Thousands
35.0 34.7 34.7 34.8 34.9 34.7 34.7 34.5 34.8 34.9 34.7 34.5 34.6 34.2 34.4 34.6 34.8 35.0
Jun16 Jul Aug Sep Oct Nov Dec Jan17 Feb Mar Apr May Jun17
In 1,000
Source: Department of Labor Statistics 60
Cheaha Economic Activity Zone 34
Employment Talladega County 2007-2016 in Thousands
36.9 35.5 32.3 30.4 31.2 31.7 32.6 32.7 32.9 32.4 30 32 34 36 38 07 08 09 10 11 12 13 14 15 16 In 1,000
Source: Department of Labor Statistics 61
Employment Talladega County June 16 – June 17 in Thousands
32.4 32.3 32.3 32.4 32.3 32.2 32.2 31.8 32.3 32.8 33.0 32.8 32.6 31.0 31.5 32.0 32.5 33.0 33.5
Jun16 Jul Aug Sep Oct Nov Dec Jan17 Feb Mar Apr May Jun17
In 1,000
Source: Department of Labor Statistics 62
Cheaha Economic Activity Zone 35
63
Unemployment Rate Talladega County vs Alabama 2007 – 2016
5.2% 7.2% 14.4% 13.5% 11.6% 9.4% 8.6% 7.8% 6.6% 6.8% 4.0% 5.7% 11.0% 10.5% 9.6% 8.0% 7.2% 6.8% 6.1% 6.0%
0.0% 5.0% 10.0% 15.0% 20.0% 07 08 09 10 11 12 13 14 15 16 Talladega Alabama
Source: Department of Labor Statistics 64
Unemployment Rate Talladega County vs Alabama June 2016 – June 2017
7.0% 6.8% 7.0% 7.1% 7.2% 6.8% 7.0% 8.0% 7.1% 6.1% 5.0% 4.8% 5.7% 6.3% 6.1% 6.2% 6.2% 6.2% 5.7% 5.9% 6.8%6.1% 5.3% 4.4% 4.2% 5.2%
3% 4% 5% 6% 7% 8% 9%
Jun16 Jul Aug Sep Oct Nov Dec Jan17 Feb Mar Apr May Jun17
Talladega Alabama
Source: Department of Labor Statistics
Cheaha Economic Activity Zone 38
Labor Force CEAZ 2007-2016 in Thousands
142.4 141.6 140.6 136.9 136.6 134.4 133.9 132.6 130.9 130.6 128 132 136 140 144 07 08 09 10 11 12 13 14 15 16 In 1,000
Source: Department of Labor Statistics 65
Labor Force CEAZ June 16 – June 17 in Thousands
131.1 130.9 130.5 130.7 131.5 130.7 130.7 130.1 131.1 131.3 130.8 130.3 131.0 130.0 130.5 131.0 131.5 132.0
Jun16 Jul Aug Sep Oct Nov Dec Jan17 Feb Mar Apr May Jun17
In 1,000
Source: Department of Labor Statistics 66
Cheaha Economic Activity Zone 39
Employment CEAZ 2007-2016 in Thousands
136.4 133.1 123.6 120.9 122.6 123.1 123.3 123.0 122.6 122.4 116 120 124 128 132 136 140 07 08 09 10 11 12 13 14 15 16 In 1,000
Source: Department of Labor Statistics 67
Employment CEAZ June 16 – June 17 in Thousands
122 123 122 122 123 123 122 121 123 124 125 125 124 118 120 122 124 126
Jun16 Jul Aug Sep Oct Nov Dec Jan17 Feb Mar Apr May Jun17
In 1,000
Source: Department of Labor Statistics 68
Cheaha Economic Activity Zone 40
69
Unemployment Rate CEAZ vs Alabama 2007 – 2016
5.2% 7.2% 14.4% 13.5% 11.6% 9.4% 8.6% 7.8% 6.6% 6.8% 4.0% 5.7% 11.0% 10.5% 9.6% 8.0% 7.2% 6.8% 6.1% 6.0%
0.0% 5.0% 10.0% 15.0% 20.0% 07 08 09 10 11 12 13 14 15 16 CEAZ Alabama
Source: Department of Labor Statistics 70
Unemployment Rate CEAZ vs Alabama June 2016 – June 2017
6.6% 6.4% 6.5% 6.5% 6.6% 6.0% 6.3% 7.1% 6.4% 5.6% 4.7% 4.5% 5.3% 6.3% 6.1% 6.2% 6.2% 6.2% 5.7% 5.9% 6.8% 6.1% 5.3% 4.4% 4.2% 5.2%
3% 4% 5% 6% 7% 8%
Jun16 Jul Aug Sep Oct Nov Dec Jan17 Feb Mar Apr May Jun17
CEAZ Alabama
Source: Department of Labor Statistics
Cheaha Economic Activity Zone 41
Alabama Unemployment Rates
June 2017
Preliminary State Rate (Not Seasonally Adjusted)
State Ave – 5.2%
Unemployment Rate
6.5% and Below 6.6% - 7.9% 8.0% and Above
Source: US Bureau of Labor Statistics 71
4.6% 5.9% 5.1% 5.1%
5.3%
5.7%
72
Manufacturing Sector Employment CEAZ 2006-2016 in Thousands
23.9 22.4 21.4 18.2 17.3 17.6 18.4 19.2 20.2 21.0 21.1 15 18 20 23 25 06 07 08 09 10 11 12 13 14 15 16 In Thousands
Source: U.S. Bureau of Labor Statistics
Cheaha Economic Activity Zone 42
73
Service Sector Employment CEAZ 2004-2014 in Thousands
50.7 53.6 52.5 49.4 49.4 50.7 51.5 51.6 51.4 51.9 52.2 45 48 50 53 55 06 07 08 09 10 11 12 13 14 15 16 In Thousands
Source: U.S. Bureau of Labor Statistics 74
Federal Sector Employment CEAZ 2004-2016 in Thousands
5.17 5.65 6.00 6.26 6.18 6.22 6.23 5.88 5.29 4.84 4.58 4.38 4.33 4.0 4.5 5.0 5.5 6.0 6.5 04 05 06 07 08 09 10 11 12 13 14 15 16 In Thousands
Source: U.S. Bureau of Labor Statistics
Cheaha Economic Activity Zone 43
CEAZ: Market Summary
– Labor Force – Down – Employment – Up – Unemployment – Trending Down
– Not Back to Historic Highs of 07 – Up from previous year – Reductions in Federal Employment significant (Especially for Calhoun) – State business leaders optimistic – Other areas of state show more significant recovery
75
State of Alabama Update CEAZ 2017 Economic Drivers Population Dynamics
Employment/Income/GDP Construction and Housing Autos/Energy Opportunity and Innovation
76
Cheaha Economic Activity Zone 44
Source: U.S. Census Bureau
4.454.47 4.49 4.50 4.53 4.57 4.63 4.67 4.72 4.76 4.79 4.80 4.82 4.83 4.84 4.85 4.86
4.3 4.5 4.7 4.9 5.1
2000 2002 2004 2006 2008 2010 2012 2014 2016
77
Ala 7.5 %
Ala 1.5 %
Millions
U.S. Growth 4.7%
U.S. Growth 9.7%
Workforce Dynamics Population for Alabama 2000-2016 in Millions Regional Population Percent Change (2000-2010)
9.7 7.5 9.1 17.618.3 1.4 4.3 18.5 15.3 11.5 20.6 4 8 12 16 20 24 US AL AR FL GA LA MS NC SC TN TX Percent Change
Source: U.S. Census Bureau 78
Cheaha Economic Activity Zone 45
Regional Population Percent Change (2010- July 2016)
4.7 1.5 2.5 9.6 6.4 3.3 0.7 6.4 7.3 4.8 10.8 2 4 6 8 10 12 US AL AR FL GA LA MS NC SC TN TX Percent Change
Source: U.S. Census Bureau 79
0.7 0.2 0.3 1.8 1.1 0.3 1.1 1.4 0.9 1.6 0.4 0.8 1.2 1.6 2 2.4 2.8 US AL AR FL GA LA MS NC SC TN TX Percent Change
* Top 10 States for Business
Chief Exec Magazine
AL 2017 – 19th AL 2016 – 20th
Regional Population Percent Change (July 2015 - July 2016)
Source: U.S. Census Bureau, Chief Executive Magazine 80
Cheaha Economic Activity Zone 46
4.4 4.9 3.4 4.3 4.9 5.7 4.9 4.5 4.1 4.0 4.8
2 3 4 5 6 7 8 US AL AR FL GA LA MS NC SC TN TX Unemployment Rate Percent
Regional Unemployment Rate May 2017
81
States with Neg (-) Pop’n Growth
NY, MS, WY, CT, VT, IL, PA, WV (%) 4.4, 4.9, 4.1, 4.9, 3.1, 4.6, 5.0, 4.5
Source: Bureau of Labor Statistics
U.S. Average Weeks Unemployed 1982 – June 2017
10 15 20 25 30 35 40 45
1982 1986 1990 1994 1998 2002 2006 2010 2014
Number of Weeks
Source: Bureau of Labor Statistics
39.6 24.7
82
Cheaha Economic Activity Zone 47
Regions and Divisions
83 Source: U. S. Census Bureau 84
(July 2015 - July 2016)
State MSAs 1. New York 20,153,634
Texas (4) + Florida (3) MSAs = 30% of all growth The 20 fastest growing MSAs = 56% of all growth Of the 20 fastest Of the 15 fastest growing MSAs growing large cities S Region 11 S Region 11 ( 6 in TX) W Region 8 W Region 4 NE Region 1 MW Region 1
Source: U. S. Census Bureau
Cheaha Economic Activity Zone 48
Population Change by Region Percent
2 4 6 8 10 12 14 16 18
2000-2010 2010-2016
Population Change
U.S. NE MW S W
Source: U. S. Census Bureau
3.9 6.5 3.2 6.8 9.7 1.6 14.5 1.5
85
13.8 4.7
84.7 % of U.S. 86.8% of U.S.
Population Change by Region Percent
0.00 0.25 0.50 0.75 1.00 1.25 1.50
2014-2015 2015-2016
Population Change
U.S. NE MW S W
Source: U. S. Census Bureau
0.70
Percent
0.20 1.09 0.21 1.06 0.79 0.05 1.16 0.15
86
1.15
94.3 % of U. S. 89.7 % of U. S.
Cheaha Economic Activity Zone 49
Employment Alabama 1990 – May 2017
3.0 5.0 7.0 9.0 11.0 13.0
1.5 1.7 1.9 2.1 2.3 1990 1995 2000 2005 2010 2015
Civilian Labor Force (million) Employed(million) Unemployment Rate (%)
Percent
Seasonally Adjusted
Millions Percent
87 Source: Bureau of Labor Statistics
Alabama Employment by Sector 1990 – May 2017
50 100 150 200 250 300 350 400 1990 1995 2000 2005 2010 2015 Employment in 1,000s
Manufacturing Government Trade/Trans/Util Education/Health Professional/Business Fin,Ins,Real est
Seasonally Adjusted
88 Source: Bureau of Labor Statistics
Cheaha Economic Activity Zone 50
Alabama Employment–Population Ratio 1981 – May 2017
48 52 56 60 64 68
1981 1985 1989 1993 1997 2001 2005 2009 2013 2017
% of Population Employed
Source: Alabama Dept. of Industrial Relations, U.S. Bureau of Labor Statistics
54.5% 64.4%
= Employed__ _________ Civilian noninstitutionalized population 16 +
89
55 57 59 61 63 65 67 69
1976 1984 1992 2000 2008 2016 Participation Rate (Percent)
64.4%
63.3
57.3%
Alabama Labor Participation Rate 1946 – June 2017
Participation Rate = 16(+) working or Looking for work Total population of the same age group Seasonally Adjusted
90 Source: Bureau of Labor Statistics
Cheaha Economic Activity Zone 51
U.S. Employment 1990 – May 2017
3 6 9 12 15 18
100 110 120 130 140 150 160 1990 1995 2000 2005 2010 2015
Labor Force (million) Employed(million) U6 - Unemployed (Percent) Unemployed Rate (percent)
Percen
Millions Percent
91 Source: Bureau of Labor Statistics
U.S. Manufacturing and Retail Trade Jobs & Earnings 1980 – June 2017
100.0 200.0 300.0 400.0 500.0 600.0 700.0 800.0 900.0 5 8 11 14 17 20
1980 1985 1990 1995 2000 2005 2010 2015
Manufacturing Jobs (Millions) Retail Jobs (Millions) Avg Weekly Earnings Manuf Avg Weekly Earnings Retail Trade
Source: Bureau of Labor Statistics (BLS): Table 8B. Weekly earnings production and nonsupervisory private nonfarm employees
Millions
Seasonally Adjusted
92
Cheaha Economic Activity Zone 52
Jobs Workforce and Earnings 1980 – June 2017
200 400 600 800 1000 1200
5 10 15 20 25
1980 1984 1988 1992 1996 2000 2004 2008 2012 2016
Goods Prod Employees (millions) Leisure & Hospitality Jobs (millions) Ed & Health Ser Jobs (millions) Avg Wk Earn Goods Prod Avg Wk Earn Leisure & Hosp Avg Wk Earn Ed & Health
Source: Bureau of Labor Statistics (BLS)
Millions
Seasonally Adjusted
93
U.S. Employment–Population Ratio 1975 - June 2017
54 56 58 60 62 64 66
1975 1980 1985 1990 1995 2000 2005 2010 2015
Percent of Population Employed
Source: Bureau of Labor Statistics
60.1% 64.4%
# Employed / Civilian noninstitutionalized population 16+
94
Seasonally Adjusted
Cheaha Economic Activity Zone 53
55 60 65 70
1950 1958 1966 1974 1982 1990 1998 2006 2014 Participation Rate (Percent)
(1997- 67.1%)
63.3 62.8%
U.S. Labor Participation Rate 1946 – June 2017
Participation Rate= 16(+) working or Looking for work Total population of the same age group Seasonally Adjusted
95
Source: Bureau of Labor Statistics
by Age Group (1994 – 2024)
10 20 30 40 50 60 70 80
1994 2004 2014 2024
Participation Rate
16-24 25-54 55-64 65+
Source: Bureau of Labor Statistics BLS, Monthly Labor Review, Dec. 2015
Percent
12.4 21.7
56.8 66.3 66.4
49.7
83.4
81.2
96
Cheaha Economic Activity Zone 54
Per Capita Income U.S. vs. Alabama 1990 - 2016
$10,000 $20,000 $30,000 $40,000 $50,000 $60,000 1990 1995 2000 2005 2010 2015 U.S. Alabama
97 Source: Bureau of Economic Analysis
CAGR (2006-2016) 3.5 % 2.8 % $49571
$39231 Compound Annual Growth Rate (CAGR)
U.S. and Alabama GDP Per Capita (1997-2016)
30.0 35.0 40.0 45.0 50.0 55.0 60.0 130 140 150 160 170 180 190
1997 2000 2003 2006 2009 2012 2015 Alabama GDP $Billions U.S. Per-Capita GDP $1000 Ala Per-Capita GDP $1000
98 Source: Bureau of Economic Analysis (BEA)
GDP ($Billions) GDP/Capita ($1000) Chained 2009 dollars
Cheaha Economic Activity Zone 55
Alabama – Components of GDP 1997 - 2016
5 10 15 20 25 30 35
1997 2000 2003 2006 2009 2012 2015
$Billions
Chained 2009 dollars
Government Manufacturing Prof/Bus Services Fin, Ins, Real Estate Retail Trade
99
Durable Goods
Ed/Health
Source: Bureau of Labor Statistics
U.S. And Alabama Top 5 Industries as Percent of GDP 2016
0% 5% 10% 15% 20% 25%
Alabama United States
Percent of GDP
Government Fin, Ins, Real Est Durable Goods Prof/Bus Ed/Health
Source: U.S. Bureau of Economic Analysis 100
17 16 11 10 8 12 21 6 13 9
Cheaha Economic Activity Zone 56
U.S. National Defense Budget 1995-2022 in Billions
Source: U.S. OMB Historical table (Budget authority by Function) for FY2015 Table 3.1-Outlays, DOD Budget Report/FY2016, Bloomberg Government
0.0 1.0 2.0 3.0 4.0 5.0
200 300 400 500 600 700 800
1995 2000 2005 2010 2015 2020
$Billions Percent
National Defense Budget $Billions
Defense Budget percent of GDP 705 672
101
589
Estimate
Defense Spending Ranking of Top 10 States $ Billions - FY 2015
53.0 49.3 37.9 20.5 17.6 12.6 12.6 12.2 12.2 5 10 15 20 25 30 35 40 45 50 55 VA CA TX MD FL PA WA GA AL MA
Defense Spending
12.7
Source: U.S. BEA, U.S. Dept. of Defense, Bloomberg Government, National Conference of State Legislatures
$Billions
102
Cheaha Economic Activity Zone 57
U.S. Defense Spending – State Rankings Percent of GDP 2009 vs. 2015
13.9% 13.5% 10.7% 8.6% 7.0% 6.0% 7.9%
0% 3% 6% 9% 12% 15%
VA HI AK AL MD MS KT
Percent of GDP
2009 2015
9.9% Source: U.S. Dept. of Defense, Bloomberg Government, National Conference of State Legislatures 5.9% 11.2% 5.7% 4.7% 103 9.8% 4.9%
Source: U.S. Census Bureau
0.00 0.30 0.60 0.90 1.20 1.50 1.80 2.10 2.40 2.70 3.00 2003 2005 2007 2009 2011 2013 2015
2,155,300 1,682,000 389,000 444,700 745,500 1,206,600
Peak (2005)
Housing U.S. Building Permits Privately-Owned Units 2003 - 2016
Total Units Single Unit Multi 5+ Units
Million
104
Year to Date May 31, 2017 502,100 336,400 165,600
Cheaha Economic Activity Zone 58
Source: U.S. Census Bureau
0.0 3.0 6.0 9.0 12.0 15.0 18.0 21.0 24.0 27.0 30.0 33.0 2003 2005 2007 2009 2011 2013 2015 (000)
32,034 24,654 7547 15001 3317 11692
Total 5695
Single Unit 5268
May 2017 Year-to-Date
Multi 5+ Units 427
105
Alabama Building Permits Privately- Owned Housing Units 2003 – 2016 Percent of U.S. Total Housing Units Authorized by States: 2016
13.8 9.6 8.5 5.1 4.9 3.3 3.0 2.8 2.7 3 6 9 12 15 18 TX FL CA NC GA WA CO AZ NY SC
Percent of Total
3.6
Source: U.S. Census Bureau Table 2u., Privately owned housing units 106
Top 10 = 57.3 % of U. S. Total
* * * * *
* Chief Exec. Top 10
Cheaha Economic Activity Zone 59
3.0 3.5 4.0 4.5 5.0 5.5 6.0 6.5 7.0 7.5 8.0
1982 1986 1990 1994 1998 2002 2006 2010 2014
Employment in Millions
U.S. Construction Employment
1982 – June 2017
6.89 7.69 5.44
Seasonally Adjusted
107 Source: Bureau of Labor Statistics
Alabama Construction Employment 1990 – May 2017
60 80 100 120 1990 1995 2000 2005 2010 2015 Employment -Thousands
112.8 87.3
108 Source: Bureau of Labor Statistics
Seasonally Adjusted
Cheaha Economic Activity Zone 60
Median Asking Price and/or Asking Rent for Vacant Housing Units 2001 – 2016
450 500 550 600 650 700 750 800 850 80 100 120 140 160 180 200
2001 2003 2005 2007 2009 2011 2013 2015 Asking Price ($000) Asking Rent ($)
Source: U.S. Census Bureau
Nominal Dollars
109
Housing Statistics for Alabama May 2016 vs. May 2017
Source: Alabama Center for Real Estate (ACRE)
May 2016 May 2017
% Change Total Homes Sold
5279 5839
10.6%
$164,995 $175,766
6.5%
Days on Market
138 135
Units Listed
30,515 26,851
110
Cheaha Economic Activity Zone 61
State and National Economic Drivers
Automotive Manufacturing
Market and Driving Trends Energy Issue
111 Source: Economic Development Partnership of Alabama
*Assembles Dodge Sprinter vansVehicle Assembly Plants in Southeastern United States
112
Cheaha Economic Activity Zone 62
Source: 2007 EDPA Automotive Database
Automotive Industry Clusters in Alabama
Legend
Concentration of Automotive Suppliers
Suppliers by Zip Code
1 2 3 4 - 6 7 - 11 20 59 65 59 20 65 85 10There are more than 383 Automotive Companies and Suppliers in Alabama.
113 Source: U. S. BEA, BLS
5 10 15 20 25
1990 1993 1996 1999 2002 2005 2008 2011 2014
Employment in 1000s
Alabama Motor Vehicle and Parts Employment 1990 – 2016
Employment – Vehicle Manuf (000) Employment – Parts Manuf (000)
MB Honda Hyundai IH Toyota
26.1 12.9
114
Cheaha Economic Activity Zone 63
Alabama Motor Vehicle Production 2004 -2016
115 Source: Economic Development Partnership of Alabama (EDPA), Alabama Automotive Manufacturers Association (AAMA), Alabama Dept. of Commerce
200 400 600 800 1000 1200 04 05 06 07 08 09 10 11 12 13 14 15 16
In Thousands 1,048,000
Alabama 2016 Export $9.0 Billion Vehicles and Parts
Source: U.S. BLS, BEA,
3 6 9 12 15
1990 1993 1996 1999 2002 2005 2008 2011 2014
U.S. Motor Vehicles and Parts Manufacturing Employment 1990 – 2016
In 100s of Thousands 944,100 1,313,000 660,000
116
Cheaha Economic Activity Zone 64
Source: U.S. ESA, Federal Reserve System, Int. Org. of Motor Vehicle Manuf. (OICA)
2 4 6 8 10 12 14 1986 1993 2000 2007 2014
U.S. Motor Vehicle Car & Lt. Commercial Vehicle Production 1986 – 2016 Millions
Total for All Auto Manufacturers (millions)
Total Foreign-Affiliated Mfg. (millions)
12.6 12.2 5.1 2.51 Millions
117
0.0 5.0 10.0 15.0 20.0 25.0 30.0 35.0 40.0 45.0 50.0 10 30 50 70 90 110 130 150 1967 1977 1987 1997 2007 2017 Percent Change in GDP Thousands of Units/Quarter
Source: BEA
GDP %Change/Qtr
Truck Sales (000)/Qtr
1967 – Qt1-2017 Thousands of Units/Quarter
Sales GDP
Seasonally Adj
118
Cheaha Economic Activity Zone 65
U.S. Total Vehicle-Miles Traveled vs. Per Capita Vehicle Miles Traveled (VMT) 1970-2016
8,000 9,000 10,000 11,000 12,000 13,000 14,000 1.0 1.5 2.0 2.5 3.0 3.5
Source: U.S. DOT, FHWA
Total Traveled (Trillions) Per Capita VMT
119
Per Capita VMT = Total Miles Traveled Civilian Population age 16+
13,225
12,431
Trillions
Motor Vehicle Renewable Fuel Blending Requirements 2002-2016-2022
Source: U.S. EIA
10 20 30 40 02 04 06 08 10 12 14 16 18 20 22 Renewable Fuel Billions of Gallons Required Ethanol Percent Blended
Required By EISA 2007 FRG 1990 36 Billion gal
120
Blend Wall 10%
Cheaha Economic Activity Zone 66
80 90 100 110 120 130 140 150 Billions of Gallons
U.S. Gasoline Current and Projected Use 1977 – 2016 – 2040
CAFÉ
1985 – 27.5 mpg 2016 – 35.5 mpg 2025 – 54.5 mpg 142.3 103
121 Source: U.S. EIA
ISSUES and CHALLENGES
National and State Economic Drivers
122
Cheaha Economic Activity Zone 67
Port of Mobile
Source: Alabama State Port Authority, Alabama Seaport Sp13 123
Economic Drivers
124
Source: Alabama State Port Authority
Cheaha Economic Activity Zone 68
Alabama Aerospace
Delta Atlas V
126
Alabama Aerospace
Airbus A320
125
Cheaha Economic Activity Zone 69
Alabama Aerospace Blue Origin (BE-4) Engine
127
State of Alabama Summary
Regionally High
Spending Correlation
Innovation and Dynamic Change
128
Cheaha Economic Activity Zone 70
CEAZ: Summary
– Down from historic highs – Up recently
– Down from historic highs – Up recently
– Down from recent highs – Trending lower
recovered to some extent
– State and local business leaders remain cautious – Other areas of state have seen more significant recovery
129
Pound-for-pound the best newspaper in Alabama
To Subscribe to The Anniston Star Call