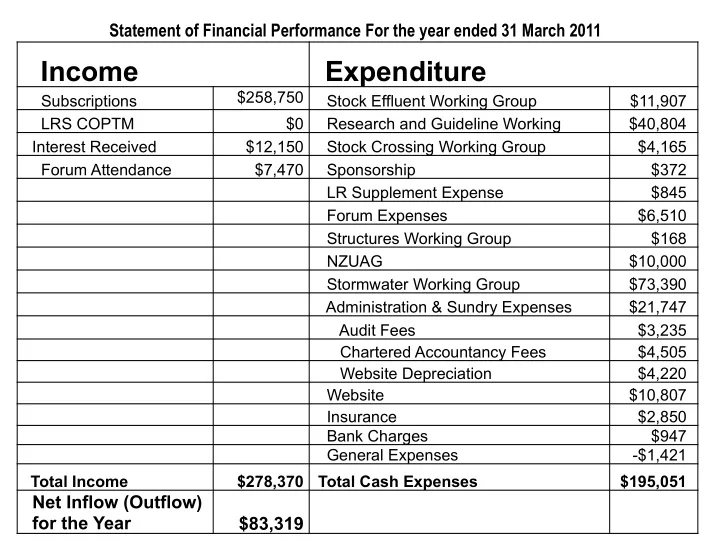
income expenditure
play

Income Expenditure $258,750 Stock Effluent Working Group - PowerPoint PPT Presentation

Statement of Financial Performance For the year ended 31 March 2011 Income Expenditure $258,750 Stock Effluent Working Group Subscriptions $11,907 LRS COPTM $0 Research and Guideline Working $40,804 Interest Received $12,150 Stock


  1. Statement of Financial Performance For the year ended 31 March 2011 Income Expenditure $258,750 Stock Effluent Working Group Subscriptions $11,907 LRS COPTM $0 Research and Guideline Working $40,804 Interest Received $12,150 Stock Crossing Working Group $4,165 Forum Attendance $7,470 Sponsorship $372 LR Supplement Expense $845 Forum Expenses $6,510 Structures Working Group $168 NZUAG $10,000 Stormwater Working Group $73,390 Administration & Sundry Expenses $21,747 Audit Fees $3,235 Chartered Accountancy Fees $4,505 Website Depreciation $4,220 Website $10,807 Insurance $2,850 Bank Charges $947 General Expenses -$1,421 Total Income $278,370 Total Cash Expenses $195,051 Net Inflow (Outflow) for the Year $83,319

  2. 2010/2011 Budget Forecast Annual Expenditure Annual Totals Actual to Percentage to ( by quarter) 31/3/2011 Date Group Period 1 Period 2 Period 3 Period 4 Road/Rail Crossings 0 0 0 0 0 Stormwater 5,000 5,000 29,000 29,000 68,000 73,390 108% Income 0 0 0 0 0 LRS COPTTM 2,000 2,000 2,000 2,000 8,000 845 11% Income -2,500 -2,500 -2,500 -2,500 -10,000 0 0% Stock Crossings 1,500 500 500 500 3,000 -9,335 -311% Stock Effluent 9,000 9,000 9,000 9,000 36,000 11,907 33% Structures 2,000 2,000 2,000 2,000 8,000 168 2% Performance System 0 Strategy NZUAG 2,500 2,500 2,500 2,500 10,000 10,000 100% Workgroup research and development 10,000 10,000 10,000 10,000 40,000 13,500 34% Administration Financial transactions and reporting 5,375 5,375 5,375 5,375 21,500 21,747 101% Website service agreement & hosting 3,500 3,500 3,500 3,500 14,000 10,807 77% Website depreciation 3,750 3,750 3,750 3,750 15,000 4,220 28% Annual accounts 4,000 4,000 0% Annual financial audit 3,000 3,000 7,740 258% Miscellaneous contingency 2,000 2,000 0% Research and Guidelines Group 7,500 7,500 7,500 7,500 30,000 40,804 136% Insurance 2,220 2,220 2,850 128% Legal (contingency) 1,500 1,500 0 0% Bank interest -500 -500 -500 -500 -2,000 -12,150 608% Bank Fees 947 Promotional - Excellence awards 22,500 22,500 372 2% Forums Content and Incorporation Admin 8,127 8,127 8,127 8,127 32,507 0 0% NZTA support -8,127 -8,127 -8,127 -8,127 -32,507 0% Forums expense 4,000 4,000 4,000 12,000 6,510 54% Forums income -2,500 -2,500 -2,500 -7,500 -7,470 100% General Expenses -1,421 Subscriptions Income -287,500 -287,500 -258,750 90% Totals -236,155 49,625 96,125 84,125 -6,280

  3. StarBng ¡Bank ¡Balance ¡as ¡at ¡1 ¡April ¡2010 ¡ $ ¡ ¡ ¡ ¡ ¡ ¡ ¡ ¡241,641 ¡ ¡ Income ¡Received ¡2010/11 ¡ $ ¡ ¡ ¡ ¡ ¡ ¡ ¡ ¡278,370 ¡ ¡ Expenses ¡Paid ¡2010/11 ¡ $ ¡ ¡ ¡ ¡ ¡ ¡ ¡ ¡195,051 ¡ ¡ ¡ Creditors/Debtors ¡Outstanding ¡as ¡at ¡31 ¡ $ ¡ ¡ ¡ ¡ ¡ ¡ ¡ ¡ ¡ ¡14,087 ¡ ¡ March ¡2011 ¡ ¡ Year ¡End ¡Balance ¡as ¡at ¡31 ¡March ¡2011 ¡(Not ¡ $ 339,047 ¡ Cash ¡in ¡Bank) ¡ ¡ Note ¡-­‑ ¡Income/Expense ¡Figures ¡shown ¡are ¡INVOICED ¡figures ¡not ¡necessarily ¡Cash ¡in ¡Bank ¡

  4. Statement of Financial Position as at 31 July 2011 Income Expenditure Annual subscriptions $ 211,000 Projects Interest Received $ 996 Stormwater $ 2,478 Forum Attendance $ 2,882 RIMS Projects $ - NZTA Forum Admin Support $ - Stock Effluent $ 7,195 NZUAG $ - Workgroup Research and Development $ - Administration INGENIUM Admin Fee $ 5,375 Website Hosting and Email $ 4,192 Website Depreciation $ - Annual Accounting Fees $ 1,199 Audit Fees $ - Research and Guidelines Group $ 9,378 Insurance $ 1,950 Bank Fees $ 1,532 Promotional - Excellence Awards $ - Forum Expenses Forum Content Admin $ - Forum Expenses $ 2,606 Total Income $ 214,878 Total Payments $ 35,907 Net Inflow (Outflow) for year $ 178,972

  5. 2011/2012 Forecast Annual Expenditure Annual Actual to 31/7/2011 Percentage Budget ( by quarter) Totals to Date Group Period 1 Period 2 Period 3 Period 4 Stormwater 12,500 12,500 12,500 12,500 50,000 2,478 5% Income 0 0 0 0 0 RIMS 8,000 6,000 7,000 0 21,000 0 0% Stock Effluent 15,000 10,000 7,500 7,500 40,000 7,195 18% Strategy NZUAG 0 0 0 0 0 0 0% Workgroup research and 10,000 10,000 10,000 10,000 40,000 0 0% development Administration Financial transactions and reporting 5,375 5,375 5,375 5,375 21,500 5,375 25% Website service agreement & hosting 3,500 3,500 3,500 3,500 14,000 4,192 30% Website depreciation 3,750 3,750 3,750 3,750 15,000 0 0% Annual accounts 4,000 4,000 1,199 30% Annual financial audit 3,700 3,700 0 0% Research and Guidelines Group 7,500 7,500 7,500 7,500 30,000 9,378 31% Insurance 2,850 2,850 1,950 68% Bank Fees -500 -500 -500 -500 -2,000 1,532 -77% Bank Interest Received -996 Promotional - Excellence awards 1,250 1,250 1,250 1,250 5,000 0 0% Forums Forum Content Administration 8,330 8,330 8,330 8,330 33,320 0 0% NZTA support -8,330 -8,330 -8,330 -8,330 -33,320 0 0% Forums expense 4,000 4,000 4,000 12,000 2,606 22% Forums income -2,500 -2,500 -2,500 -7,500 -2,882 38% Subscriptions Income -205,000 -205,000 -211,000 103% Totals -135,775 60,875 59,375 60,075 44,550

  6. $274,543 ¡ ¡ StarBng ¡Bank ¡Cash ¡Balance ¡as ¡at ¡1 ¡April ¡2011 ¡ Income ¡Received ¡2011/12 ¡ $214,878 ¡ ¡ Expenses ¡Paid ¡2011/12 ¡ $35,907 ¡ ¡ Creditors/Debtors ¡Outstanding ¡as ¡at ¡31 ¡July ¡ $34,975 ¡ ¡ 2011 ¡ Balance ¡as ¡at ¡31 ¡July ¡2011 ¡(Not ¡Cash ¡in ¡Bank) ¡ $488,489 ¡ Note ¡-­‑ ¡Income/Expense ¡Figures ¡shown ¡are ¡INVOICED ¡figures ¡not ¡necessarily ¡Cash ¡in ¡Bank ¡

Download Presentation
Download Policy: The content available on the website is offered to you 'AS IS' for your personal information and use only. It cannot be commercialized, licensed, or distributed on other websites without prior consent from the author. To download a presentation, simply click this link. If you encounter any difficulties during the download process, it's possible that the publisher has removed the file from their server.

Recommend


More recommend