
SLIDE 1
Residential BDH Plant Commercial
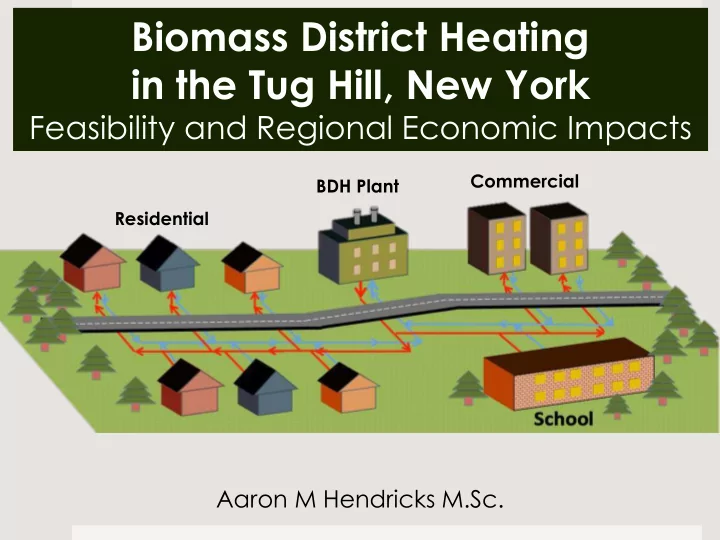
Biomass District Heating in the Tug Hill, New York
Feasibility and Regional Economic Impacts
Aaron M Hendricks M.Sc.
in the Tug Hill, New York Feasibility and Regional Economic Impacts - - PowerPoint PPT Presentation
Biomass District Heating in the Tug Hill, New York Feasibility and Regional Economic Impacts Commercial BDH Plant Residential Aaron M Hendricks M.Sc. Purpose Look for new ways to utilize the abundant forest resources of the Tug Hill to
Residential BDH Plant Commercial
Aaron M Hendricks M.Sc.
Look for new ways to utilize the abundant forest resources of the Tug Hill to stimulate the economy Village Population Village Area (km2)
Barneveld 284 0.49 Camden 2,231 6.34 Castorland 351 0.83 Cleveland 750 2.94 Copenhagen 801 3.07 Holland Patent 458 1.33 Parish 450 4.19 Prospect 291 0.55 Remsen 508 0.99 Sylvan Beach 897 1.79
Declining forest harvests
1/3 of the state’s sawmills have closed over past 15 years 40% reduction in sawtimber harvests over past 15 years Since 1990, 50% reduction in employment in the Pulp and Paper sector
Low industrial presence
Market fluctuations have stronger impact
County-wide poverty rate of 15.6%
High annual heat demands Erratic Oil Prices Annual expenditures for oil leave region (78%)
High abundance of low grade wood
Potential to establish secondary market Promote better silviculture
Wood energy is a predominantly local resource
Annual heating expenditures remain in local economy
Recently improved biomass combustion technologies
Allows for greater utilization of wood resources More efficiently meets annual heating demands Two-stage combustion boilers
Benefits
Aggregates Heat Demand Allows for utilization of low cost wood chips
Low heat density
High traffic volume Storage limitations
Convenience Establishes local industry
Low heat density in rural areas
Distribution network costs can be limiting factor
High capital costs Cost of delivered heat? Social acceptance?
Residential BDH Plant Commercial
Used specific building heat demand data from US EIA following Gils et al. (2013)
78% energy conversion efficiency used (assumes #2 fuel oil use)
Tax parcel GIS data determined specific buildings present in each village 75% village connection rate to the BDH network
Cost estimates
$1,000/kW – $1,700/kW
Picture taken from Becker et al. (2014)
Peak sizing
(Qs) * (Efficiency losses) * [(Highest Daily HDD / Total yearly HDD) / 24]
75% boiler efficiency 85% distribution network efficiency 64% overall BDH system efficiency
Network Size
Pipe Length Lspec = 1207.36 * pbuilding
(m) Pipe Diameter da = 0.0486 * ln(Qs/L) + 0.0007 (m)
Cost estimate
Cd = a ∙ (C1 + C2 ∙ da) / (Qs/L) ($/GJ)
Photos from: Community Energy Association (2014)
Sized for peak demands
(specific building heat demand) * [(Highest Daily HDD / Total yearly HDD) / 24]
Costs estimates
$300/kW to $500/kW
Photo from: Community Energy Association (2014)
Annual Wood Chip Demand
Qs * Efficiency Losses * 11.5 GJ/tonne 64% overall BDH system efficiency
Wood Chip Costs
Regional price ranged from $26.50/tonne to $46.25/tonne Price of $42/tonne used
Oil derived heat does not include capital
Every $1,000 invested raises oil fired heat price $1.05/GJ
Results comparable to other studies
Gils et al (2013): Natural gas CHP networks delivered heat for NYS region between $20.81/GJ-$37.01/GJ Sherman (2013): Feasibility assessment for Fleischmanns, NY generated estimates of $37.47/GJ-$38.83/GJ
45,883 tonnes of wood chips demanded annually
Represents <5% of harvests residues available each year in Lewis, Oneida, and Oswego Counties Equivalent to 1.1% annual NYS pulpwood, chip, and firewood harvests
Village Annual Heat Demand (GJ) Annual Wood Chip Demand (Metric Tonnes) Total Annual Cost Price
Delivered Heat ($/GJ) Parish 21,904 2,984 $844,568 $38.56 Prospect 9,575 1,304 $351,702 $36.73 Price
Heat Derived from #2 Fuel Oil = $35.22 Holland Patent 22,160 3,019 $773,741 $34.92 Remsen 20,080 2,735 $691,201 $34.42 Copenhagen 26,330 3,587 $895,979 $34.03 Cleveland 30,126 4,104 $1,024,172 $34.00 Camden 119,008 16,211 $4,005,245 $33.66 Sylvan Beach 48,673 6,630 $1,634,146 $33.57 Castorland 20,016 2,727 $627,127 $31.33 Barneveld 18,960 2,583 $564,813 $29.79
Roughly 100 GJ/building needed for profitable marginal connection (Average across all villages) Although not beneficial at the margin, households add to
THEORY AND METHODS
The goal is to capture the “total effect” of BDH on the regional economy “You’ve got to spend money to make money”
Following the dollars through the regional economy The economic ripple effect
BDH Network Expenditure Pattern $11,412,694 heat delivered annually
x = (I-A)-1f = Lf
RECEIPTS EXPENDITURES Activities Factors Inst Exports Total Output Activities Ind 1 Ind 2 . . . Ind n T11 T13 T14 q1 Factors EC PI OPI T21 T24 q2 Inst HH Cap Ent Govt T31 T32 T33 T34 q3 Imports T41 T42 T43 T44 q4 Total Outlays q'1 q'2 q'3 q'4
x = [(I-A)-1di]β = Lf
Impact Type Employment Labor Income Total Value Added Output Direct Effect N/A N/A N/A N/A Indirect Effect 98.0 $4,029,382 $6,019,005 $13,137,926 Induced Effect 45.3 $1,814,746 $3,495,822 $5,531,880 Total Effect 143.3 $5,844,128 $9,514,827 $18,669,806
Each $1 million invested:
Major industries affected 1) Construction of new non-residential industrial (63 jobs, $9.2 million output) 2) Forestry and Logging (23 jobs, $2.2 million output) 3) Real Estate (2.3 jobs, $1 million output) Tax generation
Heat cost savings ($500,000/yr across region)
Expenditure Pattern Approach
No BDH networks to model expenditure pattern after Loss of endogenous impacts
Model scale
Larger areas expand inter-industry connections, thus increasing economic impact What portion of the economic impact is centered around study villages? Oswego? Utica? Villages vs. Model Region
7,021 people vs. 272,899 people 23 km2 vs. 8,939 km2
Easily replicable, remote study
BDH and Rural development
Silver buckshot, not silver bullet
Focus on specific applications
Downtown areas, school and surrounding neighborhood
Other renewable energy technologies?
Citing appropriate technology Comparing efficiency and efficacy
Sizing boiler, determining costs Need for more empirical data on BDH
Network, boiler, ETS cost Establishing expenditure pattern
Modeling economic impacts in rural regions Comparison to other renewable energy incentives
Efficacy? Efficiency? Appropriate technology?