SLIDE 1
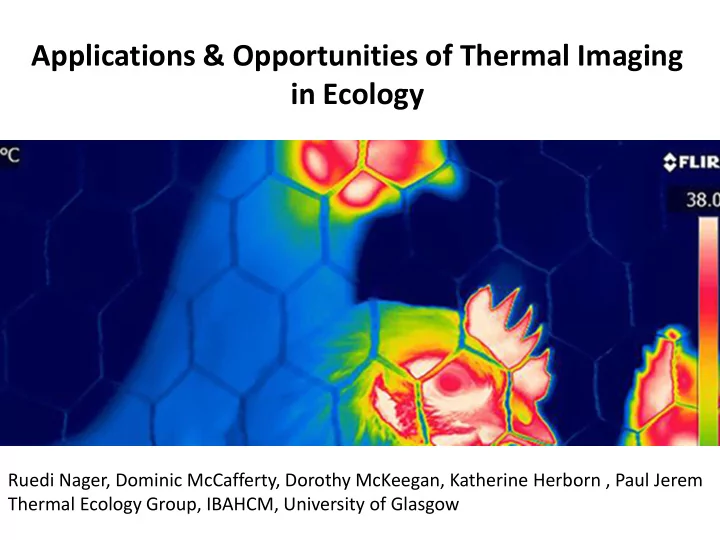
Applications & Opportunities of Thermal Imaging in Ecology
Ruedi Nager, Dominic McCafferty, Dorothy McKeegan, Katherine Herborn , Paul Jerem Thermal Ecology Group, IBAHCM, University of Glasgow
SLIDE 2
IRT in Animal Research
Surveying Wildlife Energy Expenditure Examine Injuries Assessment of Stress
http://www.gla.ac.uk/researchinstitutes/bahcm/research/sigs/thermalecologygroup
Thermal Ecology Group
SLIDE 3
Surveying Wildlife Counting Animals
SLIDE 4
Presence of nesting an elusive nocturnal burrow nester, the Manx Shearwater, on Ailsa Craig?
SLIDE 5
Assessing Physiological State
Energy Expenditure Assessment of Stress
SLIDE 6
Body Surface temperature
Environment (sun, wind) will change local peripheral temperature Physiology increased metabolic rate altered blood flow
Temperature at any anatomical region = product of metabolic heat production, blood flow within that region, and heat exchange with environment from physical processes. This is going to vary across the body surface
What does Thermal Imaging measure?
SLIDE 7
SLIDE 8
Handling Stress of Wild Blue Tits
SLIDE 9 Temperature Response to Handling
Jerem et al. 2015 Journal of Visualised Experiments e53184
SLIDE 10
Proportionality of Response
Cradled Side
V
Does a more intense stressor trigger a different temperature response?
SLIDE 11 Proportionality of Response
Herborn et al. 2015 Physiology & Behaviour 152,225
Handling of different stressor intensity
It is graded response, not just response/no response
SLIDE 12 Baseline Temperature
Birds with lower body surface temperature were in poorer body condition
- That could be because birds in poorer body condition reduce their
energy expenditure and produce less heat
- Alternatively birds in poor body condition could be chronicallt
stressed which reduces surface temperature as for the birds in the handling stress.
- The latter scenario is supported by birds with lower body surface
temperature having higher levels of corticosterone circulating in their plasma
SLIDE 13
Examine Injuries Examine Injuries
SLIDE 14 Examine Injuries
Patterson et al 2010 Marine Mammal Science 27, 295-305 78, 1477
Marking of Marine Mammals
SLIDE 15 Examine Injuries
Some birds had one leg warmer than the other leg
- This was not affected in birds that wore the standard
metal and small colour rings
- But the data suggests legs with heavier rings (that
carry PIT tags are more likely warmer than the leg with just a standard small ring
SLIDE 16
Examine Injuries
The herring gull on the right wears a harness, and there are no heat leaks that would indicate that the harness has damaged to plumage.
SLIDE 17
IRT Research in Animals
- Might allow monitoring animals that are difficult to assess
- Changes in surface temperature can pick up intensity of acute stress
- Baseline surface temperature may reflect chronic stress
- Allows detecting remotely the effects of injuries