in authentic learning? What is the atmosphere? How do we study it? - - PowerPoint PPT Presentation

in authentic learning
SMART_READER_LITE
LIVE PREVIEW

in authentic learning? What is the atmosphere? How do we study it? - - PowerPoint PPT Presentation

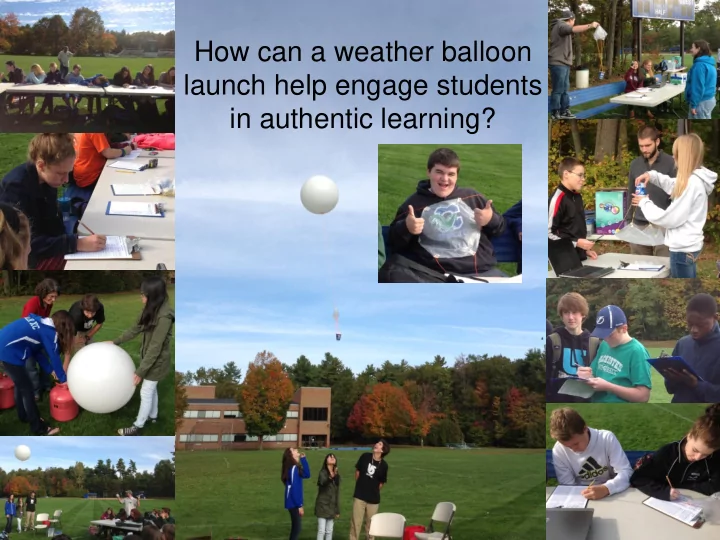
How can a weather balloon launch help engage students in authentic learning? What is the atmosphere? How do we study it? Felix Baumgarnters stratospheric jump 1:30 summary montage https://www.youtube.com/watch?v=FHtvDA0W34I How do we study


slide-1
SLIDE 1

How can a weather balloon launch help engage students in authentic learning?

slide-2
SLIDE 2

What is the atmosphere? How do we study it?

Felix Baumgarnter’s stratospheric jump

1:30 summary montage https://www.youtube.com/watch?v=FHtvDA0W34I

slide-3
SLIDE 3

How do we study conditions inthe atmosphere?

GOES: geostationary

Operational Environmental Satellite

Accessed on 9.30.13 from: http://4.bp.blogspot.com/_ddqtkOiADuo/TESByWXE06I/AAAAAAAAFA U/GeCaNxjoifY/s1600/GOES- 13+is+America%E2%80%99s+New+GOES-EAST+Satellite.jpeg

POES: polar-orbiting

Operational Environmental Satellite

Accessed on 9.30.13 from: http://www.automatedsciences.com/intro/intro.shtml

Animation to show POES v. GOES: http://spaceplace.nasa.gov/geo-orbits/

Unpiloted NASA weather drone

Image accessed on 9.30.13 from: http://weatherlabs.planet-science.com/weather- forecasts/where-do-forecasters-get-data.aspx

Human free fall jumps

Accessed on 9.30.13 from: http://www.extremetech.com/extreme/137867-the-best- photos-and-videos-of-felix-baumgartners-record-breaking-skydive

Weather balloons Doppler RADAR

Image accessed on 9.30.13 from: http://www.uvm.edu/~swac/?Page=photogallery.html

Weather observations

Accessed on 9.30.13 from: http://www.southcoasttoday.com/apps/pbcs.dll/article?AID=/20070228/NEWS/702280 334&cid=sitesearch

slide-4
SLIDE 4

Goals

  • how atmospheric properties vary with altitude
  • how radiosondes and SWAC Sondes work
  • explore weather balloon launch data
  • logistics of a weather balloon launch
  • curriculum connections
slide-5
SLIDE 5

What is the atmosphere?

  • envelope of gases surrounding a planet

Graph image accessed on 3.16.2014 from: http://pattiisaacs.files.wordpress.com/2011/12/air-composition-pie-chart2.jpg Sky image accessed on 3.16.2014 from: http://climate.nasa.gov/system/news_items/main_images/blue_sky_clouds_538px.jpg

slide-6
SLIDE 6

How is the atmosphere structured?

Image accessed on 3.13.14 from: http://ete.cet.edu/gcc/style/images/uploads/student%20pages/earth- atmosphere-layers.jpg Image accessed on 3.13.14 from: http://media.web.britannica.com/eb-media/56/97256- 004-E3540AD9.jpg

slide-7
SLIDE 7

What is a Radiosonde?

radio – sends a radio signal sonde – device to collect physical data

  • Balloon carries meteorological

instruments aloft

  • Temperature, moisture, pressure,

and wind measured at many levels

  • Provides snapshot of these

variables in the vertical

  • This information allows

meteorologists to diagnose the atmosphere in the vertical

slide-8
SLIDE 8

Why are these measurements important?

  • These observations allow us to diagnose the

atmosphere similar to the snapshot that blood pressure measurements provide the doctor

  • When coupled with surface weather reports and

satellite data, we get a 3 dimensional view (horizontal, vertical and time) of atmosphere

  • These measurements provide clues assisting the

meteorologist in understanding and anticipating motion in the atmosphere

slide-9
SLIDE 9

What does a vertical plot look like?

  • Temperature and Dewpoint

(moisture) are plotted at appropriate pressure levels

  • Temperature values are

connected with RED line

  • Dewpoint values are

connected with GREEN line.

  • The closer together the

temperature and dew point, the more moist the air is.

  • Where the lines are close,

clouds are likely

slide-10
SLIDE 10

Note relationship between temperature and altitude

CricketSonde Temperature

5 10 15 20 25 30 35

  • 70
  • 60
  • 50
  • 40
  • 30
  • 20
  • 10

10 20 30

Temperature (ºC)

Altitude (km)

  • Temperature decreases

with altitude in lower portion of atmosphere (Troposphere)

  • Temperature increases

with altitude in upper portion of atmosphere (Stratosphere)

slide-11
SLIDE 11

NWS Radiosonde System

  • Atmospheric Measurements
  • Temperature, Pressure, Humidity, Wind

(indirectly)

  • Air-borne Payload System -

$250

  • Weather balloon, Helium, Parachute,

Radiosonde (403 MHz or 1.6 GHz)

  • Ground Receiving Station -

>$2000 (without computer)

  • 5-Element Yagi antenna and tripod, UHF

radio receiver and modem, Computer and data collection software

  • Advantages
  • Robust data , Automatic data collection,

Stratosphere and troposphere measurements (30 km altitude)

  • Disadvantages
  • High system cost , Apparently available only

for government and research use , Encoded data requires expensive computer software to decipher

slide-12
SLIDE 12

UVM SWAC Sonde

  • Air-borne Payload System: -

$100

  • Party balloon (Helium-filled), Model rocket

parachute, UVM CricketSonde (434 MHz) housed in simple enclosure

  • Ground Receiving Station -

$230

  • 3-Element Yagi Antenna, UHF Radio

Receiver, Pen and Paper

  • Advantages
  • Simple data collection method provides,

real-time results, Launch most any place

  • r time, Low system cost, Troposphere

measurements (up to 10 km using party balloon), Stratosphere measurements (up to 30 km using weather balloon)

  • Disadvantages
  • May require technician-class amateur

(Ham) radio license to operate

slide-13
SLIDE 13

SWAC Sonde

slide-14
SLIDE 14

How does a SWAC Sonde communicate temperature?

slide-15
SLIDE 15

CricketSonde practice

Conditions Sample # Pressure (mb) ___ ___ ___ ___ Temperature (K) ___ ___ ___ Humidity (%) ___ ___

slide-16
SLIDE 16

Flight data (condensed) practice

Sample # Altitude (km) Pressure (mb) ___ ___ ___ ___ Temperature (K) ___ ___ ___

1 0.110 1000 2 9 8 2 1.0 900 2 9 __ 3 3.0 700 2 __ __ 4 4.2 600 __ __ __ 5 5.6 500 __ __ __ 6 9.1 300 __ __ __ 7 10.4 250 __ __ __ 8 11.8 200 __ __ __ 9 __ __. __ 150 __ __ __ 10 __ __. __ 100 __ __ __

slide-17
SLIDE 17

5 10 15 20 200 210 220 230 240 250 260 270 280 290 300

Altitude (km) Temperature (K)

Temperature (K) vs. Altitude (km) To convert pressure to altitude, students can interpolate using the graph above or they can use an online calculator such as the

  • ne on NOAA:

http://www.srh.noaa.gov/epz/?n =wxcalc_pressurealtitude

5 10 15 20 200 210 220 230 240 250 260 270 280 290 300 Altitude (km) Temperature (K)

Temperature (K) vs. Altitude (km)

Troposphere Stratosphere Tropopause

slide-18
SLIDE 18

Data exploration

  • Using data from today’s forecasted sounding,

you will:

In Excel:

  • 1. Graph sounding (temperature and altitude) data

2 Determine the altitude of the bottom of the tropopause

  • 3. Calculate ascent rate

Measure the circumference of a party balloon Measure the mass of the payload

  • 4. Calculate flight time to reach tropopause

In Google Earth:

  • 5. Map where the balloon would travel if launched today from

UVM and your school

slide-19
SLIDE 19

Discussion of data exploration

  • Where would your balloon end up?
slide-20
SLIDE 20

Curriculum connections

slide-21
SLIDE 21

Colchester H.S. example

  • Studied structure, function, composition of atmosphere
  • Design challenge (payload, parachute, & “if found” letter)
  • Data collection
  • Data analysis & communication through formal scientific poster
slide-22
SLIDE 22

Questions and Closing

Image accessed on 3.16.2014 from: http://www.nasa.gov/images/content/407252main_image_1529_946- 710.jpg