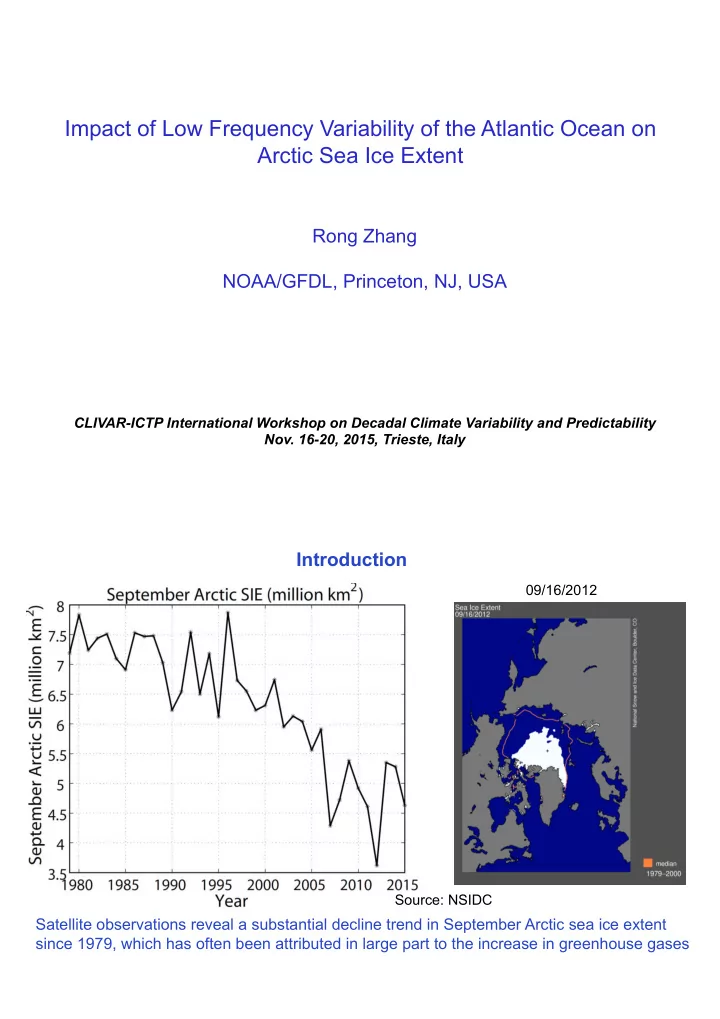

! Impact of Low Frequency Variability of the Atlantic Ocean on Arctic Sea Ice Extent Rong Zhang NOAA/GFDL, Princeton, NJ, USA CLIVAR-ICTP International Workshop on Decadal Climate Variability and Predictability Nov. 16-20, 2015, Trieste, Italy Introduction 09/16/2012 "#$%&'(!)"*+,! Source: NSIDC Satellite observations reveal a substantial decline trend in September Arctic sea ice extent since 1979, which has often been attributed in large part to the increase in greenhouse gases
While the Arctic sea ice extent (SIE) declin the Antarctica sea ice extent (SIE) increa since 1979. UIUC, Cryosphere Today What causes the opposite trends? Observed Multidecadal Variations in Arctic SAT 8'09211#0!'2!/34!5667! -#./00'11'0!'2!/34!5667!
Atlantic Meridional Overturning Circulation (AMOC) :$;3<%#=2!'2!/34!566>! What is the role of low frequency AMOC variability in the observed Arctic sea ice decline since 1979? Impact of AMOC on Winter Arctic Sea Ice Variability Modeled Regression on AMO Observed Trend (1979-2008) (Mahajan, Zhang, and Delworth, 2011) GFDL CM2.1 1000-year control simulation ! • Winter Arctic sea ice in the Atlantic side declines with an intensified AMOC • Similar spatial patterns suggest a possible role of the AMOC in the observed sea ice decline • The anti-correlation between AMO and winter Arctic sea ice is also found in other CMIP3 models (Day et al. 2012) and paleo records (Miles et al. 2014)
Tropical Fingerprint of AMOC Variations !"#$%&'( Zhang, 2007 )**+%&'( The weakening of the AMOC leads 9,<C=( 9,<C=( )**+%&'( !"#$%&'( • A southward shift of the Intertropi Convergence Zone (ITCZ) and T surface cooling Subsurface (z=400m) Surface • Thermocline deepening/weakene western boundary current and ,-."&(/.$0.#"/1#.("&*$"+2(31.(/*(/4.(5."6.&%&'(*7(89,)((7#*$(:;<=()9>?@(5"/.#(4*A%&'(.B0.#%$.&/( subsurface warming in the TNA • Observed Tropical North Atlantic (TNA) SST is anti-correlated with TNA subsurface ocean temperature • The anti-correlated variations is shown to be a fingerprint of AMOC variations, suggesting the AMOC was weakened during the 70’s and strengthened since then • The AMOC induced anti-correlated TNA surface and subsurface temperature variations are also found in CMIP5 models (Wang and Zhang, 2013) and paleo records (Schmidt et al. 2012, PNAS) Extra-tropical AMOC Fingerprint – Leading Mode of Upper Ocean Heat Conten Zhang and Zhang, 2015 Similar southward AMOC propagation also exists in isopycnal coordinate model GFDL CM2G (Wang et al., 2015), and high-resolution models GFDL CM2.5 (Zhang et al., 2011) and UK HiGEM (M. Thomas, personal communication, 2015)
Schematic Diagram for the Mechanism of the Evolution of the AMOC Fingerprint Zhang and Zhang, 2015 The slow propagation of the AMOC anomaly is crucial for the evolution and the enhanced decadal predictability of the AMOC fingerprint, consistent with recent decadal prediction studies that successfully predicted the warm shift in the North Atlantic SPG during the mid 1990s by initializing a stronger AMOC at northern high latitudes (Robson et al., 2012; Yeager et al., 2012; Yang al., 2013; Msadek et al., 2014) Observed Extra-tropical AMOC Fingerprint (1955-2014) Decline Strengthen
Mechanisms for Low Frequency Variability of Summer Arctic Sea Ice Exten =!E%%#M(!E23/0F&!*0N#M! /09'!E%%#M(!O/&@P&!*0N#M!! R.'!E23/0F&!@0N#M!'02'%1!2.'!E D/@03S!2.%#$9.!2.'!*&'3/0=J "/0=!L@=9'!/0=!T$%2.'%!1A3@21 @02#!2M#!D/@0!<%/0&.'1(!! B(!8/%'021!"'/!BA'0@09! #0'!'02'%1!2.'!8/%'021!"'/!/&%# G(!G/12!Q%/D!"2%/@2!! 2.'!8/%'021!"'/!BA'0@09!U8"BVW (!+/C@1!"2%/@2! 2.'!#2.'%!N#M1!0#%2.M/%=!/1!2. (!8'%@09!"2%/@2! ?'12!"A@21<'%9'0!,$%%'02!/&%#1 2.'!'/12!Q%/D!"2%/@2!UQ"GVW!! <#2.!'C'02$/33S!%'/&.!&'02%/3!E% Zhang, 2015, PNAS .@2'!#%!%'A%'1'021!B<1'%C'=! D/2#3#9@&/3!"'A2'D<'%!E%&F&! GFDL CM2.1 !#C'%!HI>IJ56HK! 3600-year Control Simulation HT ATL : Northward Atlantic Heat Transport across the Arctic Circle GFDL CM2.1 3600-year Control Simulation
Impact of Atlantic heat transport on Arctic Sea Ice Mass at All Seasons
Schematic of Main Gateways of Atlantic and Pacific Inflow Entering the Arctic and Arctic Ocean Circulation =!E%%#M(!E23/0F&!*0N#M! /09'!E%%#M(!O/&@P&!*0N#M!! R.'!E23/0F&!@0N#M!'02'%1!2.'!E D/@03S!2.%#$9.!2.'!*&'3/0=J "/0=!L@=9'!/0=!T$%2.'%!1A3@21 @02#!2M#!D/@0!<%/0&.'1(!! B(!8/%'021!"'/!BA'0@09! #0'!'02'%1!2.'!8/%'021!"'/!/&%# G(!G/12!Q%/D!"2%/@2!! 2.'!8/%'021!"'/!BA'0@09!U8"BVW (!+/C@1!"2%/@2! 2.'!#2.'%!N#M1!0#%2.M/%=!/1!2. (!8'%@09!"2%/@2! ?'12!"A@21<'%9'0!,$%%'02!/&%#1 2.'!'/12!Q%/D!"2%/@2!UQ"GVW!! <#2.!'C'02$/33S!%'/&.!&'02%/3!E% @2'!#%!%'A%'1'021!B<1'%C'=! D/2#3#9@&/3!"'A2'D<'%!E%&F&! !#C'%!HI>IJ56HK! XR 8"B! (!G/12M/%=!X'/2!R%/01A#%2!/&%#11!8"BW!!XR Q"G (!)#%2.M/%=!X'/2!R%/01A#%2!/&%#11!Q"G!! RGYO 8"B! (!/C'%/9'=!E23/0F&!?/2'%!2'DA'%/2$%'!/2!566D!/3#09!8"B !! AMOC index : maximum of Atlantic meridional overturning streamfunction at 45 o N in density space !
Linkage with March Barents Sea SIE Variability Observed (NSIDC) Barents Sea Ice Concentration in Late Winter (March-April) "D'=1%$=!'2!/34!56HK! HI>I! 566Z! Observed Ocean Heat Transport across Barents Sea Opening (HT BSO ) ! ! " %2.$0!'2!/34!56H5!! The observed increase in HT BSO is also found as a prime driver for the observed sea ice decline in Barents Se
Response of Atmosphere Heat Transport • The Bjerknes compensation (Bjerknes, 1964) has been found at decadal time scale (Shaffrey & Sutton, 200 Jungclaus & Koenigk, 2010; Farneti and Vallis, 2013) • At multidecadal/centennial time scale, the coherences among HT ATL , Arctic SHF, and inverted HT ATM are mu higher than those at decadal time scale • Changes in HT ATM are forced by anti-correlated changes in HT ATL thus provide a negative feedback to September Arctic SIE variations
Summary and Discussions • The AMOC variability and the associated Atlantic heat transport into the Arctic have played a significant role in the low frequency variability of summer Arctic SIE • Summer Arctic SIE variations are significantly correlated with winter SIE variations in Barents Sea in both modeled results and observations, indicating the importan role of the Atlantic heat transport into the Arctic • AMOC fingerprints indicate a strengthening of AMOC since mid 70’s, consisten with the observed decline of Arctic sea ice • At low frequency, changes in atmosphere heat transport into the Arctic are forced by anti-correlated changes in the Atlantic heat transport into the Arctic, thus provide a negative feedback to changes in summer Arctic SIE • Enhanced Pacific heat transport into the Arctic and Positive Arctic Dipole also contribute to summer Arctic sea ice decline 21 IJS'/%!A/$1'! U566>J56H[V! ? Very recent study identified a 7-year pause (2007-2013) in summer Arctic sea ice decline (Swart et al. 2015). If the AMOC continues to weaken in the near future, there might be a longer hiatus in the September Arctic SIE decline
Recommend
More recommend