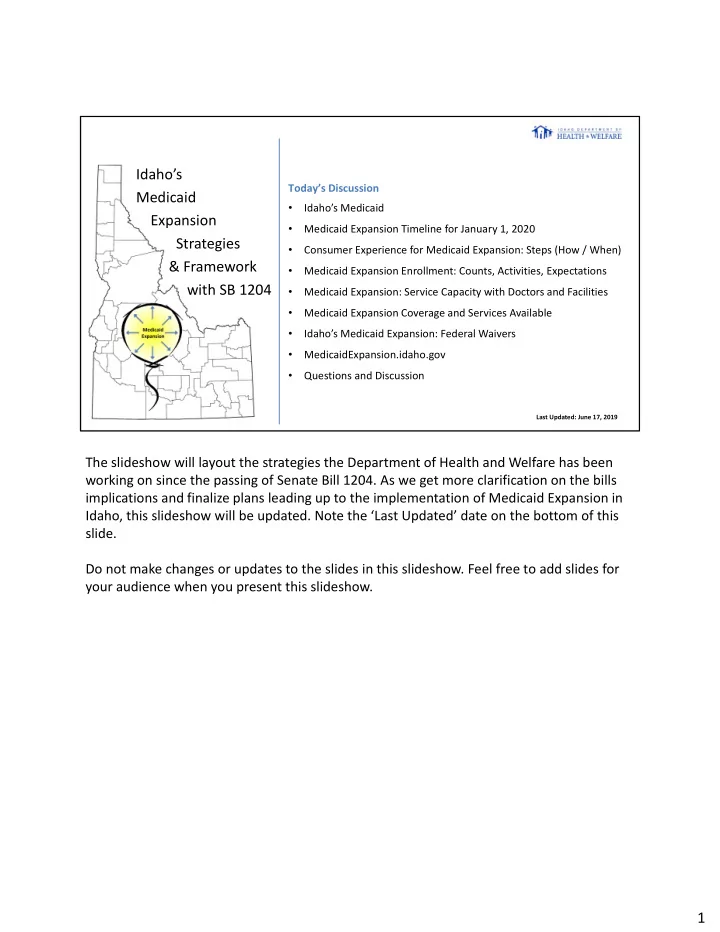
SLIDE 6 Medicaid Expansion Estimates
Almost 70,000 individuals in Idaho are known to the Department and are thought to be eligible for Medicaid Expansion. County level estimates of these individuals are shown in the map and table below. It is estimated another 21,000 individuals, not known to the Department, make up the projected number of 91,000 potentially Medicaid eligible individuals. County Population Estimated Medicaid Expansion by County County Population Estimated Medicaid Expansion by County Count Count Count Percent Ada 456,849 14,612 3.20% Gem 17,379 834 4.80% Adams 4,147 167 4.03% Gooding 15,124 634 4.19% Bannock 85,269 3,969 4.65% Idaho 16,369 533 3.26% Bear lake 6,028 245 4.07% Jefferson 28,446 1,251 4.40% Benewah 9,184 355 3.86% Jerome 23,627 960 4.06% Bingham 45,927 2,014 4.38% Kootenai 157,637 5,951 3.78% Blaine 22,024 696 3.16% Latah 39,333 1,068 2.72% Boise 7,290 311 4.26% Lemhi 7,875 438 5.56% Bonner 43,560 1,931 4.43% Lewis 3,887 231 5.94% Bonneville 114,595 5,619 4.90% Lincoln 5,318 259 4.88% Boundary 11,922 542 4.55% Madison 39,141 2,366 6.05% Butte 2,602 112 4.30% Minidoka 20,729 821 3.96% Camas 1,102 49 4.47% Nez Perce 40,385 1,205 2.98% Canyon 216,699 10,418 4.81% Oneida 4,427 154 3.47% Caribou 7,034 236 3.35% Owyhee 11,628 598 5.14% Cassia 23,664 1,009 4.26% Payette 23,215 1,066 4.59% Clark 873 18 2.11% Power 7,600 358 4.71% Clearwater 8,546 282 3.30% Shoshone 12,542 736 5.87% Custer 4,172 205 4.92% Teton 11,381 435 3.82% Elmore 26,823 1,059 3.95% Twin falls 85,124 3,934 4.62% Franklin 13,564 508 3.74% Valley 10,687 395 3.69% Fremont 13,094 774 5.91% Washington 10,121 502 4.96% Total Population Count 1,716,943 69,860
This map and table show where approximately 70,000 people, known to the IDHW and who are thought to be eligible for Medicaid Expansion, live in Idaho (using address information on file). We can identify these individuals because of their recent participation in programs such as SNAP, Behavioral Health, the Advanced Payment of the Tax Credit (APTC), or because they have children in other programs or recently closed programs. These ‘Known Customers’ will be targeted through IDHW’s Assisted Enrollment process. Not shown on this map and table are an additional 21,000 ‘Unknown Individuals’ that Milliman estimated will enroll based on our states census data. On the map, the dark red counties are the ones with the highest percentage of the population who might be eligible for Medicaid under expansion. Counties range from 2.11% to 6.05% of their total county population with new Medicaid coverage. This information will be important for enrollment and matching strategies.
6