
SLIDE 1
ICARUS T600 commissioning
- M. Antonello
INFN - Laboratori Nazionali del Gran Sasso
XCVII Congresso Nazionale SIF
ICARUS T600 commissioning M. Antonello INFN - Laboratori Nazionali - - PowerPoint PPT Presentation
ICARUS T600 commissioning M. Antonello INFN - Laboratori Nazionali del Gran Sasso XCVIICongressoNazionaleSIF ICARUS T600 cryogenic plant Liquid Argon Time Projection Chamber 500t Liquid Argon 1.5m maximum drift Key feature: LAr
INFN - Laboratori Nazionali del Gran Sasso
XCVII Congresso Nazionale SIF
N2 48 12 units,
Closed circuit cooling system
Liquid Argon Time Projection Chamber – 500t Liquid Argon – 1.5m maximum drift Key feature: LAr purity from electro-negative molecules (O2, H2O,C02). Minimal requirement: 0.3 ppb [O2]eq= 1 ms lifetime (1.5 m drift @ Edrift = 500 V/cm). LAr temperature uniformity (<1 K) all over the active volume.
GA GAr Recirculation LAr Recirculation
100 Nm3/h on the gas phase (~40 Nm3) 4 m3/h on the liquid phase (~550m3)
20m
1. Vacuum phase
2. N2 cooling phase
3. LAr filling phase
4. Detector commissioning 5. LAr forced purification
Procedure carefully studied to obtain a ready to go experiment (LAr purity!!) and successfully tested at the ICARUS T300 test run
W = 580 mbar, P0 E = 450 mbar
pumping
with pressure decrease.
surfaces during cooling-down phase), 17% N2, 4% O2, 2% Ar, 7% CO2
Stop of one turbo pump Residual man-hole leak repair (araldite) TARGET PRESSURE
END OF THE VACUUM PHASE
PW = 4.5● 10-5 mbar; LW = 6● 10-2 mbar l/s (4 x 313 l/s effective pumping speed)
WEST EAST One order of magnitude be0er (P and L) then what obtained in T600 test run
ppm H20, <0.1 ppm O2, < 0.3 ppm N2) +100mbar overpressure
T = 90 K smoothly reached in 13 days
temperatures and displacement always monitored
through a 50 kW electrical heater and safely evacuated from hall B via the ventilation system.
foreseen quantity
tested.
in total, 4 LAr trucks/day (~18 tons each).
(before cryostat input)
meters
addition
NO TPC WIRES DAMAGES OVER ~ 53000 WIRES!! GOOD INITIAL LAr PURITY LOW NOISE FROM CRYOGENICS
SUCCESFULL CRYOGENIC COMMISSIONING
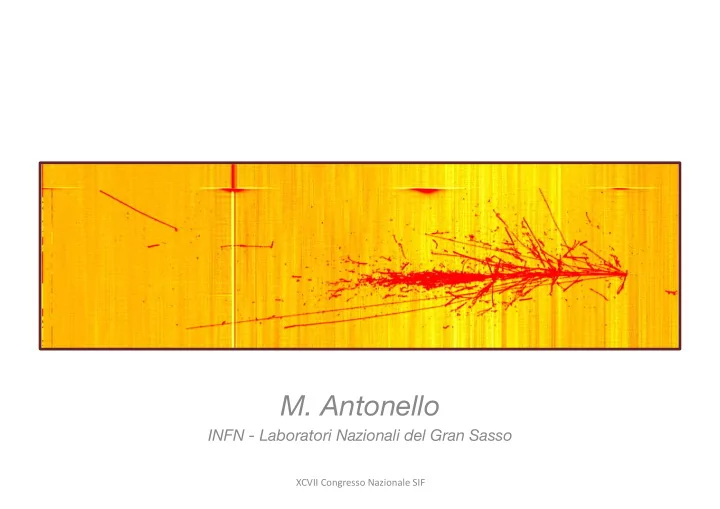
CollecRon view Wire coordinate (8 m) DriV Rme coordinate (1.4 m) CNGS ν beam direcRon
with respect our expectations due to several technical problems (in Pavia run was switched on just after the filling completion):
– West cryo (P002) on June 29, 2010 – East cryo (P001) on July 10, 2010
guaranteeing LAr purity ~6ms = 50 ppt!!!
Lower Limit 1ms
XCVII Congresso Nazionale SIF
Displacement vs time Displacement vs pressure
Wall displacement under vacuum phase for West cryo
P = 80 mbar for 22 h
insulating honeycomb panels under dynamic pumping – Typical vacuum level:
side in the middle of the insulation panels: Sud (102) Ovest (111, 117) Est (120, 126)
282 ÷ 284 K
temperature <∆T> ≈ -7 K Compatible with simulations (3 ÷ 7 K)
specifications.
stop filling = 18th of May - h. 10.30 ≈ 14 days
Average filling rate : ≈ 1.5 m3/h (22 mm/h) Average filling rate ≈ 0.7 m3/h (10 mm/h)
Cryo West LAr filling
CapaciRve level meter trend Final LAr level ≈ 3825 mm fixed using point-like level sensors
t0 = 3rd of May - h. 07.00 t0 = 3rd of May - h. 07.00 stop filling = 14th of May - h. 20.30
Cryo East LAr filling
Residual gas analysis during vacuum phase for East cryo
Water 70% Nitrogen 15% Oxygen 3.3% Argon 1.2% Carbon Dioxide 10.5% Water 71% Nitrogen 18% Oxygen 3.7% Argon 2.2% Carbon Dioxide 3.7%
Residual gas analysis during vacuum phase for West cryo
Cryo WEST Temperature trend on the same vertical
Cryo WEST Max ΔT on 3 different verticals on the same wire chamber structure ‐ 1 K/ h average cooling speed ΔT < 50 K
May 3, 2010 18:25:07 May 4, 2010 07:11:47
Gas chromatograph measurement (Air Liquide)
≈ 20‐50 ppb O2 ppm
MagneRc safety disk opening on East Cryo just few hours aVer filling compleRon (≈ 4 m3 loss)
MagneRc safety disk
From other emergency events occurred in normal (more stable) cryo pressure condiRons we extrapolated about 7 hours (as a maximum) to reach the same situaRon in case of lack of cooling on GAr recirculaRon systems.
Few hours aVer the compleRon of East cryo fillling, due to a Lab electrical power cut the N2 pump cooling the GAr recirculaKon systems went into cavitaKon and stopped. Argon pressure quickly increased making the magneKc safety disks open on East cryo. P cryo est = 272 mbar when problem
m3 LAr loss without serious safety problems for the LNGS West cryo was sRll under filling during this emergency, so it had an higher space for gas during pressure increase. We operated a manual decrease of pressure on it to avoid safety disks opening.
Refilling