i 70 mountain corridor freight
play

I-70 Mountain Corridor Freight CDOT (Tim Baker, Mehdi Baziar, - PDF document

Project Team and Panel UCD (Bruce Janson and Susi Marlina) I-70 Mountain Corridor Freight CDOT (Tim Baker, Mehdi Baziar, Bernie Forecasting Project Guevara, Scott Hoftiezer, Peter Kozinski, Brian Pinkerton, Juan Robles, Saeed Sobhi,


  1. Project Team and Panel • UCD (Bruce Janson and Susi Marlina) I-70 Mountain Corridor Freight • CDOT (Tim Baker, Mehdi Baziar, Bernie Forecasting Project Guevara, Scott Hoftiezer, Peter Kozinski, Brian Pinkerton, Juan Robles, Saeed Sobhi, A Partnership of CDOT, DRCOG Liz Stolz, Steven Abeyta, David Reeves) And University of Colorado Denver • DRCOG (Erik Sabina) Study Area Corridor Definition • 
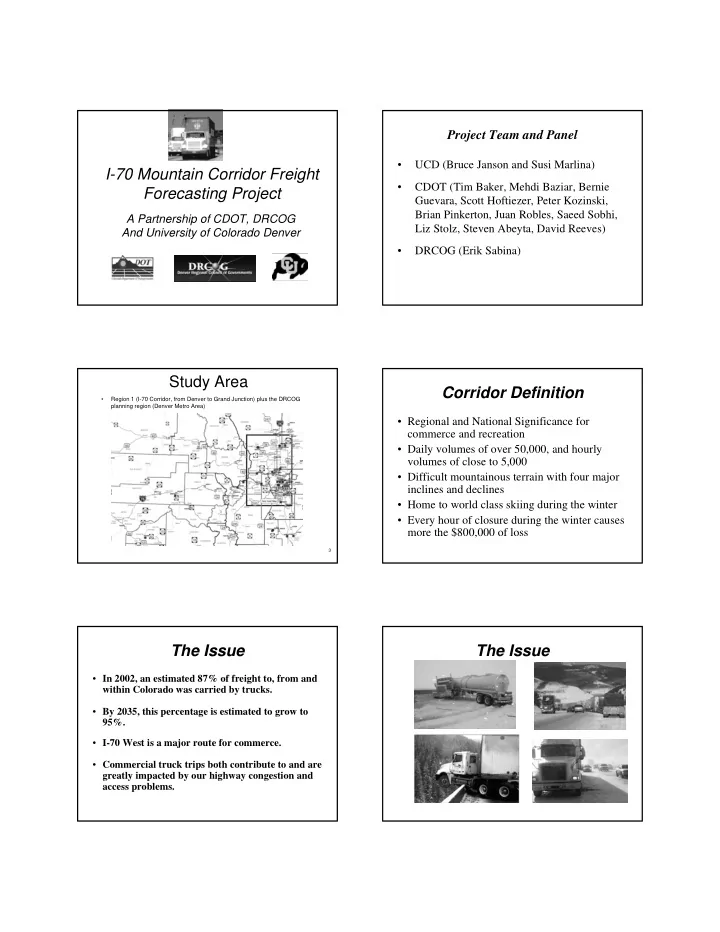
Region 1 (I-70 Corridor, from Denver to Grand Junction) plus the DRCOG planning region (Denver Metro Area) • Regional and National Significance for commerce and recreation • Daily volumes of over 50,000, and hourly volumes of close to 5,000 • Difficult mountainous terrain with four major inclines and declines • Home to world class skiing during the winter • Every hour of closure during the winter causes more the $800,000 of loss 3 The Issue The Issue • In 2002, an estimated 87% of freight to, from and within Colorado was carried by trucks. • By 2035, this percentage is estimated to grow to 95%. • I-70 West is a major route for commerce. • Commercial truck trips both contribute to and are greatly impacted by our highway congestion and access problems.

  2. Where Freight Demand The Solution: Active Management Forecasting Fits? Truck Maps, Parking Chain Sites, Food Services, Stations • Answer questions and support decisions on: Incident – Freight movement sensitivity to both operational Mgt, Variable Closures, and demand management strategies and policies. Speed Stickers, Limits Coord. – Range of economic impacts. mtgs. – Location and operation of truck parking facilities. Demand Management – Ability to communicate with policy makers and Strategies stakeholders such as the trucking industry groups ITS, Fiber Optics Heavy & (CMCA), truck parking operators, ski industry, Travel Time, Light Duty CCTV’s, 511, Downhill Warning and local communities. Courtesy CoTrip.Org Systems, RWIS, Speed Patrols, Radar Vendors Study Objective Challenges • Develop a cost-effective approach to Develop Freight Trip Forecasting Methods for CDOT and DRCOG that assist the identification and analysis improve the estimates of truck travel in of regional transportation alternatives. the transportation planning process. • Incorporate data on land uses, truck counts and • Design model that best uses both existing classifications, and origin–destination surveys. and new survey data to avoid excessive • Integrate methods with DRCOG/CDOT models to achieve truck trip generation, distribution, and route cost for data gathering, data validation, choice consistent with these models. and its use within the model. Study Process Study Process 4. Develop, implement, calibrate, and validate 1. Produce an assessment of potential freight the freight forecasting model chosen. forecasting methods pertinent to truck travel forecasting in Region 1 and the DRCOG region. 5. Analyze impacts of example traffic 2. Formulate freight forecasting model and data management alternatives to reduce gathering plan to predict truck trip generation, congestion delays. distribution, and path choice at the zonal level. 3. Based on finding of Tasks 1 and 2, collect and 6. Summarize findings of the scenario assemble the data needed and feasible for the evaluations and document the use of the freight forecasting model chosen. model.

  3. Freight Forecasting Project Flowchart Status of Progress Task 1 (Dec, 2008 – Feb, 2009): • Literature Review from previous studies - Four steps modeling: Trip Generation, Trip Distribution, Modal Split, and Route Assignment. - Assessed approached implemented by Baltimore and Atlanta using Direct Estimation as being most relevant to what we sought to accomplish. Status of Progress Find Locations on Study Network Task 2 (Feb – April, 2009) • 339 locations from 48-hour count sites • Identify data sources and locations • 69 locations from ATR sites CDOT • 115 locations from DRCOG count sites � 48-hour count :1176 locations (949 with 523 total locations where truck GPS coordinates) classification counts were taken in � ATR: 106 sites (54 axle and 32 length recent years that are on our study classification, 4 radar, and 16 WIM) network. DRCOG � 120 Sites

  4. Disaggregated Vehicle Types On Going • Developed factor from ATR counts to adjust CDOT 48-hour counts and DRCOG 1. Commercial Vehicle: light/medium duty vehicles used for business counts for: 2. Single Unit Truck (SUT): 2 axle, 6 tires a.Time of day 3. Large Combination Vehicle (LCV): 3 axle b.Day of week plus c.Month of year d.Time since count taken Next • Develop truck trips (O-D) including EE, EI, and IE trips (E = external, I = internal). • Calibration • Model Validation • Model Application � evaluate scenarios with performance measures

Download Presentation
Download Policy: The content available on the website is offered to you 'AS IS' for your personal information and use only. It cannot be commercialized, licensed, or distributed on other websites without prior consent from the author. To download a presentation, simply click this link. If you encounter any difficulties during the download process, it's possible that the publisher has removed the file from their server.

Recommend


More recommend