http://www.ncas.ac.uk Questions Do we have a simple picture of - - PowerPoint PPT Presentation

http ncas ac uk questions
SMART_READER_LITE
LIVE PREVIEW

http://www.ncas.ac.uk Questions Do we have a simple picture of - - PowerPoint PPT Presentation

Probing urban canopy dynamics using direct numerical simulations (DNS) O. Coceal 1a , T.G. Thomas 2 & S.E. Belcher 1 1 Department of Meteorology, University of Reading, UK, 2 School of Engineering Sciences, University of Southampton, UK a Email:


slide-1
SLIDE 1

Probing urban canopy dynamics using direct numerical simulations (DNS)

  • O. Coceal1a, T.G. Thomas2 & S.E. Belcher1

1Department of Meteorology, University of Reading, UK, 2School of Engineering Sciences, University of Southampton, UK aEmail: o.coceal@reading.ac.uk, aWeb: www.met.rdg.ac.uk/~sws97oc

http://www.ncas.ac.uk

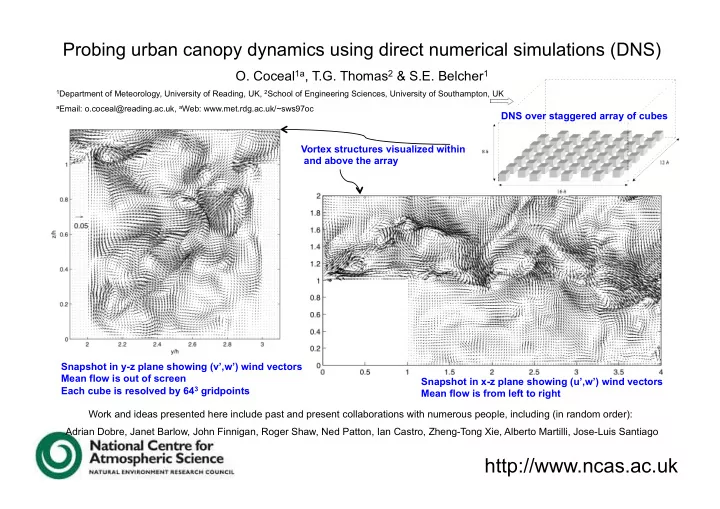
Work and ideas presented here include past and present collaborations with numerous people, including (in random order): Adrian Dobre, Janet Barlow, John Finnigan, Roger Shaw, Ned Patton, Ian Castro, Zheng-Tong Xie, Alberto Martilli, Jose-Luis Santiago Snapshot in x-z plane showing (u’,w’) wind vectors Mean flow is from left to right Snapshot in y-z plane showing (v’,w’) wind vectors Mean flow is out of screen Each cube is resolved by 643 gridpoints Vortex structures visualized within and above the array DNS over staggered array of cubes

slide-2
SLIDE 2

Questions

 Do we have a simple picture of urban canopy turbulence?

  • Taking inspiration from, but not being biased by, vegetation canopy ideas

 How do flow features and statistics depend on urban canopy parameters?

  • Indeed, what ARE those parameters?

 How do we parameterize drag and turbulence in urban areas?

  • Or perhaps, how we should NOT parameterize them

This talk will bring together just a few results from my work that are relevant to those questions, rather than describe any individual piece of work in detail. Results are mainly from direct numerical simulations (DNS) and large eddy simulations (LES).

slide-3
SLIDE 3

Some results relevant to the structure and dynamics of urban turbulence

slide-4
SLIDE 4

Two-point correlations and quadrant analysis

Exuberance Ruu for zero time delay

slide-5
SLIDE 5

Eddy structure and a conceptual model

Instantaneous realisations EOF reconstruction Conditional eddy Conceptual model

Coceal, Dobre & Thomas, IJC 2007 Coceal, Dobre, Thomas & Belcher, JFM 2007

slide-6
SLIDE 6

Flow dependence on urban morphological parameters and wind conditions

slide-7
SLIDE 7

Dependence of flow statistics on building layout

Different building layouts, same packing density of λ = 0.25 (Detailed explanation of this plot in Coceal, Thomas, Castro & Belcher, BLM 2006)

  • Large differences between staggered

and aligned/square configurations

  • Turbulence intensities, shear stress and

mean velocity all lower in staggered array

  • Dispersive stress profiles are

qualitatively different due to very different mean flow structure

  • Sectional drag coefficient in the

staggered array is an order of magnitude larger

  • Because of these large differences,

different degrees of staggering need to be explored

slide-8
SLIDE 8

Effect of variable building heights

Xie, Coceal and Castro, BLM 2008

Spatially averaged velocities Dispersive stress Drag profiles due to individual buildings TKE profile

  • Spatial averages are surprisingly similar to

regular array below mean building height

  • But tall buildings have large effect
  • Eg 22% of drag exerted by tallest building
  • Large amount of TKE due to tallest building
  • Spatially averaged TKE profile peaks at the

height of the tallest building (not the mean building height) TKE countours at several heights

slide-9
SLIDE 9

Influence of other parameters

 Effect of wind direction

  • Four wind directions investigated over a square array (see plot)
  • Also discussed in detail by Jean Claus this afternoon

 Effect of packing density

  • Investigated e.g. by Kanda et al (2004), Santiago et al. (2008), Kono et al. (2008), Leonardi & Castro (2009)
  • No time to review here

 Effect of building shape, degree of staggering, height variability

  • Currently under study and results will be reported at ICUC7 in Japan (July 2009)

u-v wind-vectors and w contours for 26.6° flow Spatially-averaged profiles of streamwise and lateral mean velocity in street-aligned and wind-aligned coord. systems

slide-10
SLIDE 10

Some thoughts on the parameterization of turbulence and drag

slide-11
SLIDE 11

Pressure drag

The problem with the drag coefficient approach

Staggered vs aligned arrays Cd(z) and cdmod(z) for staggered arrays at different packing densities Normalized drag profiles for random array

  • cd(z) blows up near the ground
  • It is very sensitive to building layout
  • Parameterize the drag force instead?
slide-12
SLIDE 12

Turbulent stress

  • Effective mixing length computed from DNS data for staggered array and LES data for random height staggered array
  • Mixing length is far from constant within urban canopy, unlike deep vegetation canopies
  • Blocking by strong shear layers
  • Subsequently, Kono et al found similar behaviour at a range of packing densities for both staggered and aligned arrays

Mixing length profile for random array Mixing length profile for regular stagerred array

slide-13
SLIDE 13

Dispersive stress

  • Dispersive stresses and their vertical gradients are

not small within the urban canopy

  • But how do we parameterize them?

Coceal, Thomas & Belcher, AG 2008 Xie, Coceal and Castro, BLM 2008 Dispersive stresses in random array Dispersive stresses and their gradients in regular arrays

slide-14
SLIDE 14

More Questions

 Can we obtain a simple picture of urban canopy turbulence?

  • Is there a canonical ‘urban canopy’ flow?
  • What are the dominant ‘urban canopy’ processes?
  • How do they depend on underlying canopy parameters?
  • What are these parameters?

 How can we apply knowledge at street scales to modelling in larger scale models?

  • There is a growing wealth of results and data at street scales from experiments and modelling
  • But this collective wisdom is not filtering through to the models that need them
  • Perhaps more/wider collaborations are needed between those who generate data and basic knowledge and those who build

predictive models

 What types of parameterizations are needed in applications such as NWP and dispersion?

  • What is needed in current implementations?
  • Can we do better?

 Specific issues:

  • How do we parameterize the dispersive stress?