
SLIDE 1
HowTo: Calculate Evaluation Curves in Presentation
14-11-06 1
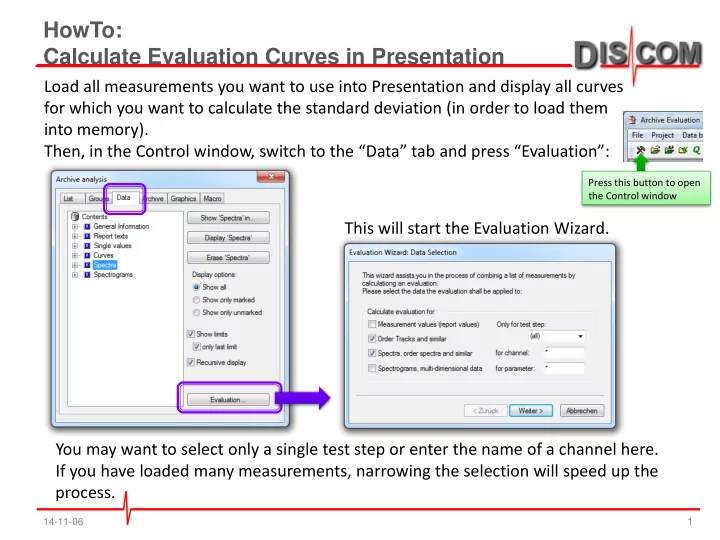
Load all measurements you want to use into Presentation and display all curves for which you want to calculate the standard deviation (in order to load them into memory). Then, in the Control window, switch to the “Data” tab and press “Evaluation”: This will start the Evaluation Wizard. You may want to select only a single test step or enter the name of a channel here. If you have loaded many measurements, narrowing the selection will speed up the process.
Press this button to open the Control window