how much do we need to understand before we intervene? Bob Harris - - PowerPoint PPT Presentation

how much do we need to understand before we intervene bob
SMART_READER_LITE
LIVE PREVIEW

how much do we need to understand before we intervene? Bob Harris - - PowerPoint PPT Presentation

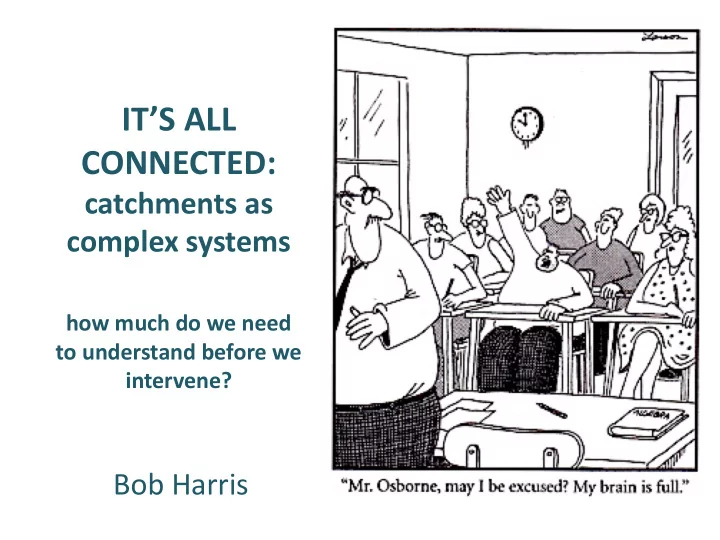
ITS ALL CONNECTED: catchments as complex systems how much do we need to understand before we intervene? Bob Harris Its a changing, integrated and uncertain world The climates changing quickly with uncertain knock on effects


slide-1
SLIDE 1

IT’S ALL CONNECTED:

catchments as complex systems

how much do we need to understand before we intervene?

Bob Harris

slide-2
SLIDE 2

It’s a changing, integrated and uncertain world

  • The climate’s changing quickly with

uncertain knock on effects and uneven impacts.

  • Populations are expanding – fast,

along with expectations/demands

  • We’re running out of resources….

including water and food

  • Economies, markets… and

environmental goods and services are now linked globally – changes happen quickly and through remote decisions

Many things are linked but we don’t know how the connections work

We live in a melange of complex adaptive systems

slide-3
SLIDE 3

Our current governance doesn’t map well to a systems approach. We don’t think this way yet – we still live and work in silos

slide-4
SLIDE 4

The problem is that “doing stuff”, in whatever domain of natural world/society,

  • ften has

unforeseen consequences

slide-5
SLIDE 5

Deliberate changes to an ecosystem can have unintended consequences:

In China during the Four Pests Campaign sparrows were killed. It was realized later that they ate lots of insects, as well as grain. Rather than increasing, rice yields decreased.

slide-6
SLIDE 6

Deliberate changes to an ecosystem can have unintended consequences:

After 1900, public demand led the US government to fight forest fires in the American West, and set aside land as national parks to protect them from fires. This led to fewer fires, but also to growth conditions so that, when fires

  • ccurred, much larger and

more damaging. Sometimes, these effects cause permanent irreversible changes… It turns out that wildfires are a natural and important part of forest ecology.

slide-7
SLIDE 7

Land use-water interactions - why did the nitrate concentrations suddenly increase? River Thames at Hampton - 1868 to present

Howden et al, 2010

Response to surface leaching from WWII ploughing Response to groundwater leaching from WWII ploughing

  • Shows a catchment-scale response and the importance of

understanding the system at this scale and…

  • a change due to a societal shift in behaviour

7

slide-8
SLIDE 8

Goulburn-Broken Catchment – a 100 year delay between intervention and (unforeseen) consequence

slide-9
SLIDE 9

Goulburn-Broken Catchment

  • 1838 – first white settlers saw farming potential. Native vegetation cover

reduced by 70%

  • Prior to settlement water tables deep; subsoil salt contents high; shallow

rooted agricultural crops allow groundwater to rise.

  • Dams (1916-1950) allowed irrigation to expand – but water table rose

further reducing unsaturated buffer.

  • Wet period of 1970s rose to 2m bgl across > 30% of region destroying high

value horticultural crops – first awareness of issue.

  • Response was to pump the groundwater but salt exported into river

system (Murray-Darling).

  • Crisis required a co-ordinated response at community level – Landcare

groups leading to CMAs.

  • But – system now in new regime. Without pumping 80% of land needs to

be reforested

slide-10
SLIDE 10

Catchments (et al) are complex adaptive or self-

  • rganising systems
  • You can change bits of a system, but the system will self-
  • rganise around this change; sometimes changes are

predictable, sometimes not… sometimes a complete surprise

  • Traditional resource management approaches focus on one

ecosystem service – e.g. food, water supply, conservation

  • But social, economic and biophysical domains are linked –

changes in one can change another; however, we tend to work in single domains

  • We also work at different scales (space and time) – each has

its own adaptive cycles, the structure and dynamics of which are driven by a set of key processes.

slide-11
SLIDE 11

Adaptive Cycle

From Walker and Salt 2006

To further complicate matters… the nature of self-

  • rganising systems is to change over time
slide-12
SLIDE 12

Thresholds and Tipping Points are important -

where an (ecological) system experiences a qualitative change, mostly in an abrupt and discontinuous way.

Figure from http://www.resalliance.org/index.php/key_concepts

slide-13
SLIDE 13

Thresholds and Tipping Points

  • Regulatory thresholds are also important for resource

management.

  • Regulatory limits should refer to points in some variable

up to which a risk of system change is allowable (e.g. regulations of nitrate or pesticides levels in drinking water).

  • While ecological thresholds are largely descriptive,

regulatory limits involve societal choices and negotiation

  • f values and aims. One should inform the other.
slide-14
SLIDE 14

So before intervening in any catchment we need to think quite a bit about the resilience of its system; understanding the thresholds, scales, cycles, feedbacks and domains…

slide-15
SLIDE 15

…but do we need to understand everything? Some things are perhaps ‘unknowable’ …and little can be known with absolute certainty

slide-16
SLIDE 16

Putting resilience thinking into practice

  • Describe/bound the system; analyse its

dynamics; decide what to do.

  • Understand:

– the important scales; – people and governance; – what we want to make resilient; – the pressures; the drivers and trends.

slide-17
SLIDE 17

Get the questions you need to answer right at the beginning

  • how precarious is your system?
  • Understand (or envisage) where thresholds lie.
  • How close is it to a position of instability?
  • How resistant is it to change (how deep is the local

basin of attraction)?

  • What is the likelihood that it will flip into a more

undesirable state?

  • Can extreme events (climate change, Brexit?)

radically alter the system or will it degrade ‘gracefully’ to ensure opportunity for recovery?

slide-18
SLIDE 18

So how does this fit with what we’re doing (in catchment management)?

  • Still looking at individual compartments – water quality

and/or single species rule?

  • So not got the whole picture yet – we’re not analysing

‘catchment systems’

  • Perhaps lacking the data we need or at least not joining

it up – certainly lacking the skills/experience… to join it all up.

  • Have we done the thinking? What are we managing to?

Achieving WFD goals or some larger aim – like a resilient catchment.

  • But resilience of what, to what? What do we want?

Can ecosystem services concepts help?

slide-19
SLIDE 19

Having the right data and sharing understanding across disciplines

  • Given ‘each catchment is different’ - different

influences and variables, there is little historical water quality data on which to characterise catchments/water bodies – most relate to assessing point source chemical pollution.

  • Limited data will effect the amount of uncertainty

and ability to detect change over natural variability in catchments/weather and farming etc. activity

slide-20
SLIDE 20

A Tipping Point in the R Clun

  • Freshwater Pearl Mussel demise
  • No recruitment for 40 years;

population crashing, about to expire

  • Many potential pressures:

nutrients, other chemicals (present and legacy), sediment (hydromorphology), temperature, flow regime (climate); etc.

  • Awareness but still general public

apathy

  • Regulatory pressure (it’s a SAC)

means many £000s spent on focused projects aimed at actions (in hope) – no real investment in research to understand the problem.

  • No systems approach envisaged
slide-21
SLIDE 21

Sediment laden rivers are choking the river bed yet sediment/turbidity is not a ‘WFD parameter’

21

slide-22
SLIDE 22

The WFD looks at the health of freshwaters which reflect the health of the catchment, but perhaps we focus too much on the water – some other parameters we might also consider in a catchment context

  • Economic health of agriculture – farm profitability
  • Indicator species – birds, bats, mammals
  • No of tourists staying > 1 night
  • % cover of woodland; trends in land use
  • Nos of earthworms in soil
  • Trends in axiophytes
slide-23
SLIDE 23

– an interesting evolution

  • Set up to look at improving water quality – make up of

research consortia mostly scientific – analytic/reductionist approach.

  • Subsequently realised that social science aspects were

important – but difficult to integrate

  • And then the economic issues became dominant in terms of

policy-making

  • The research questions changed… but the answers to the
  • riginal questions have not been answered
  • Can you undertake environmental research (involving complex

systems) on a limited budget ‘project basis’?

slide-24
SLIDE 24
  • Work more collaboratively – across disciplines;

learn each other’s language and world views

  • Understand the problem being solved in the

context of the bigger system in which it sits

  • But don’t wait to understand everything…

twin track approach

So can we have our cake and eat it too?

slide-25
SLIDE 25

Twin Track Approach

Matching up our understanding of the impact of measures with our understanding of the catchment system Scaling up Continuing characterisation – gathering evidence

Developing understanding of how the land and water interact in the catchment - iteratively, through monitoring, modelling and site investiagtion Iterative understanding

Measures where we think they may work Measures at relatively small scales

Evidence on measure effectiveness modelling modelling modelling

Twin Track Approach

slide-26
SLIDE 26

Thanks for listening

Some bedtime reading