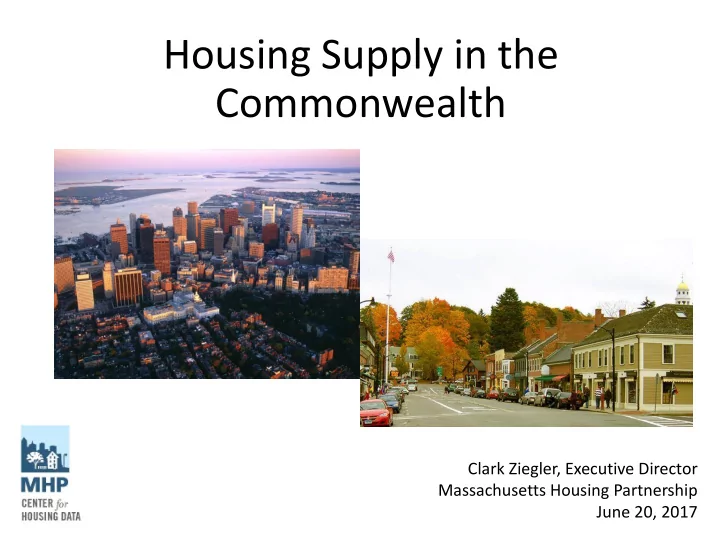

Housing Supply in the Commonwealth Clark Ziegler, Executive Director Massachusetts Housing Partnership June 20, 2017
Housing production has sharply declined in Massachusetts despite increases in population and employment Annual Housing Production in Massachusetts by Decade 35,000 30,000 25,000 20,000 15,000 10,000 5,000 0 1960s 1970s 1980s 1990s 2000s 2010s Multifamily Single Family Data from U.S. Census Bureau, Building Permit Survey. Note: in this and in all subsequent graphics, multifamily is defined as a structure with 2+ units 2 and permits are as reported by cities and towns with imputed data by the Census Bureau for communities that fail to report.
despite increasing population and employment production in the U.S. Massachusetts now has one of the lowest rates of housing New housing units permitted per 1,000 residents, 2016 1.0 2.0 3.0 4.0 5.0 6.0 7.0 8.0 - Data from U.S. Census Bureau, 2016 Building Permit Survey. Utah Idaho Colorado South Dakota South Carolina Nevada Delaware Washington North Carolina Texas Florida Tennessee North Dakota Arizona Georgia Oregon Montana Iowa Nebraska Minnesota Virginia Kansas Wisconsin Arkansas Missouri Louisiana Sources: U.S. Census Bureau and U.S. Bureau of Labor Statistics added about 246,000 residents Since 2010 Massachusetts has Alabama and 353,000 new jobs while permitting only 81,000 new Oklahoma Maine New Jersey Wyoming housing units. Kentucky New… Vermont Maryland Indiana California Massachusetts Hawaii national average rate New Mexico Mississippi Michigan Alaska Ohio Pennsylvania Illinois New York Connecticut West Virginia Rhode Island 3
Without adding any new people or new jobs, the state’s housing supply is already about 44,000 units short of demand. Most of that shortfall is in metro Boston. 12,000 Chart shows the amount of new housing needed to achieve a 6% vacancy rate for rental housing and 2% vacancy rate for 10,000 owner-occupied housing. Those are the generally accepted levels at which supply and demand is balanced and prices are stable. 8,000 Total housing needed to meet current statewide demand is approximately 44,000 6,000 Ownership units 4,000 Rental units 2,000 - Middlesex Suffolk Essex Norfolk Bristol Worcester Hampden Plymouth BarnstableHampshire Berkshire Franklin Metro Boston Counties 4 MHP analysis of county-level data from 2015 American Community Survey, U.S. Census Bureau.
The projected future need for new housing by 2030 is heavily concentrated in metro Boston and driven by the pending retirement of more than a million baby boomers Projected Net New Households, 2015 to 2030 250,000 200,000 150,000 100,000 50,000 - Metro Boston Central Franklin County & Southeast Berkshire Cape & Islands Pioneer Valley 5 Data from forthcoming report for MHP, DHCD and the Urban Land Institute by the Metropolitan Area Planning Council
Most cities and towns in metro Boston have “downzoned” so many of the most attractive single-family neighborhoods could not be built again today at the same density The average lot size for each new single family homes in metro Boston is now more than an acre, or the size of an NFL football field. The homes above – located in a desirable, walkable neighborhood – have assessed values ranging from $554,000 to $731,000. None of these homes could be built again today under current zoning. 6
Local permits for multifamily housing used to be routine. Now 210 cities and towns have gone for a decade or longer without permitting any multifamily housing of 5+ units 7
More than 30 communities served by MBTA fixed route service have permitted little or no multifamily housing over the last decade The 91 communities with fixed-route transit issued a total of 41,000 multifamily permits over the past 10 years: • Boston alone permitted more than 40% of these units; • The top 5 communities (Boston, Cambridge, Quincy, Chelsea, and Canton) permitted 64% of units; and • 33 of the 91 communities permitted fewer than 100 multifamily units each over 10 years . 8
More than half of the multifamily units recently permitted in Massachusetts were in just five cities and towns: Boston, Cambridge, Chelsea, Everett and Watertown 9
Massachusetts has become a housing cost outlier – limiting the state’s potential to create new jobs or possibly even to sustain the current level of employment 800 700 House Price Index -- 1980 = 100 600 U.S. Massachusetts 500 California Washington State Oregon 400 Colorado New York 300 200 100 1980 1985 1990 1995 2000 2005 2010 2015 10 Source: Federal Housing Finance Agency, House Price Index – All Transactions
Massachusetts rents are also among the nation’s highest, especially compared to the state’s economic competitors State data from U.S. Census Bureau, 2015 ACS; 11 Metro data from apartmentlist.com, National Rent Report, May 2017
Most of the regions with which we compete for skilled workers are building more housing and have lower housing costs 12 Source: U.S. Census Bureau
If the pace of new housing construction is maintained at 2016 levels there will be a housing shortage of over 91,000 units by 2030 Multifamily permitting in 2015 was at its highest level since the late 1980s. In 2016, there was a 6.5% drop in total permitting and a 20% drop in multifamily permitting. The single greatest driver of housing demand is the projected retirement of more than a million baby boomers in Massachusetts by 2030 and the housing needs of workers to refill those existing jobs Created by Massachusetts Housing Partnership – January 2017 13 Permit data from U.S. Census Bureau; demand projections from Metropolitan Area Planning Council MAPC housing demand projection reflects the estimated number of households based on current trends and the current age of the workforce; details at www.mapc.org/projections
For more information… Clark Ziegler, Executive Director cziegler@mhp.net Callie Clark & Tom Hopper Co-Directors, Center for Housing Data cclark@mhp.net thopper@mhp.net www.mhp.net 14
Recommend
More recommend