Hourly, daily, and seasonal patterns of atmospheric CO 2 along an - - PowerPoint PPT Presentation

hourly daily and seasonal patterns of atmospheric
SMART_READER_LITE
LIVE PREVIEW

Hourly, daily, and seasonal patterns of atmospheric CO 2 along an - - PowerPoint PPT Presentation

Hourly, daily, and seasonal patterns of atmospheric CO 2 along an urbanization gradient Allison L. Dunn 1 BR Briber 2 , LR Hutyra 2 , JW Munger 3 1 Worcester State University 2 Boston University 3 Harvard University Cities comprise ~3% of


slide-1
SLIDE 1

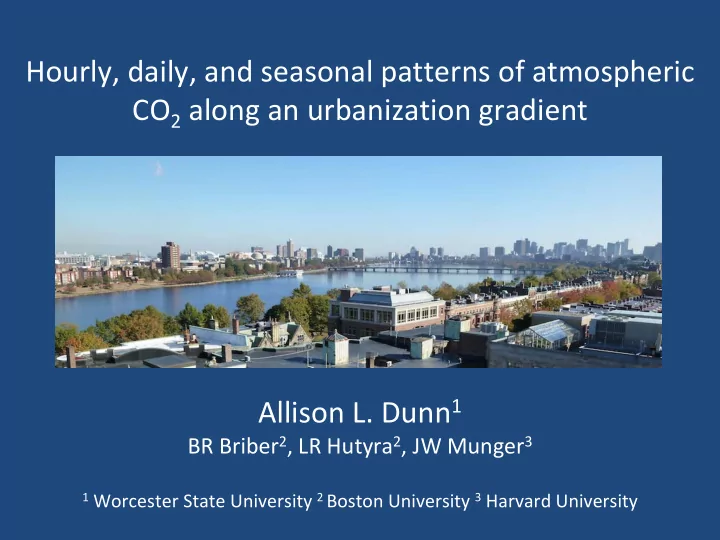
Hourly, daily, and seasonal patterns of atmospheric CO2 along an urbanization gradient Allison L. Dunn1

BR Briber2, LR Hutyra2, JW Munger3

1

Worcester State University 2 Boston University 3 Harvard University

slide-2
SLIDE 2
  • Cities comprise ~3% of global land cover (UNFPA, 2007)
  • Urban areas consume 67% of global energy and emit 71%
  • f the CO2

worldwide (IEA 2008).

  • By 2050 up to 70% of the population will live in cities; urban

land cover will expand up to 2.5 times its current extent (UNFPA 2007).

slide-3
SLIDE 3

Boston Ultra‐EX (Hutyra and Philips, BU): “How do humans and their built and natural environments interact to produce geospatially and temporally varied CO2 exchange in a region?”

  • Study the urban‐rural gradient from Boston to central

MA

  • Use CO2 to trace natural and anthropogenic processes
slide-4
SLIDE 4

Worcester Harvard Forest Boston

CO2 and meteorological measurements being made at:

  • Boston (high‐density, large urban center) – since 2/2010
  • Worcester (secondary urban center, close to

undisturbed forest) – since 4/2011

  • Harvard Forest (forest‐dominated) – since 1989
slide-5
SLIDE 5

Observations

  • Average difference between Boston and Harvard Forest

largest in summer (16 ppm), smallest in winter (11 ppm)

  • Weekday CO2

enhancement largest at Boston (3.3 ppm), smallest at Harvard Forest (0.9 ppm)

  • Mean CO2

mixing ratios were 408.2 ± 0.2, 401.5 ± 0.4, and 393.0 ± 0.3ppm at Boston, Worcester, and Harvard Forest, respectively

slide-6
SLIDE 6
  • Mean CO2

mixing ratios were 408.2 ± 0.2, 401.5 ± 0.4, and 393.0 ± 0.3ppm at Boston, Worcester, and Harvard Forest, respectively

slide-7
SLIDE 7

Boston

Worceste r Harvard Forest

  • CO2

uptake signal seen at all three locations

  • Early afternoon minima as biospheric

uptake and atmospheric mixing are maximized

  • Early morning CO2

maxima reflect buildup of biogenic and anthropogenic emissions under a stable atmosphere

slide-8
SLIDE 8

Where next?

  • Expanding observational network to incorporate new

sampling locations: Prudential Building (Boston ), Nahant (coastal north of Boston), UMASS‐Boston (on Boston Harbor)

  • This CO2

data is being assimilated into a model‐data fusion framework to independently infer high‐resolution sources and sinks of CO2 from the spatially dispersed concentration time series

slide-9
SLIDE 9
  • Mean fossil fuel CO2

emissions for MA: ~ 12.3 MgC ha‐1 yr‐1 (half from the Boston MSA)

  • Mean CO2

sink at Harvard Forest: ~2.5 MgC ha‐1 yr‐1

  • Atmospheric CO2

signal integrates biogenic and anthropogenic processes

slide-10
SLIDE 10

Where next?

  • The Stochastic Time‐Inverted Lagrangian

Transport (STILT) model is being run on nested domains of 36, 12, 4, and 1.3 km

  • Combined with a meteorological model (WRF), estimates of urban

sources from this project, modeled vegetation sources and sinks

  • Because STILT is time‐inverted, it will directly estimate surface

fluxes on the basis of observed concentrations and a priori boundary conditions

slide-11
SLIDE 11

Figure courtesy Levi, McKain, and Wofsy

  • STILT captures the basic timing, shape of CO2
  • bservations
  • Model overestimates CO2

during mid‐morning; combination of vehicular emissions, difficulties modeling destratification

  • f PBL, and biospheric

transition

slide-12
SLIDE 12

Any future international treaty to reduce emissions of GHGs will require monitoring, reporting, and verification Coupling observations with models is critical to distinguishing natural and anthropogenic sources and sinks of carbon dioxide Our current observational network is focused on ‘natural’ and managed ecosystems, not on urban regions where emissions dominate.

slide-13
SLIDE 13

Acknowledgements

Steve Raciti Steve Wofsy David Foster Nathan Phillips Curtis Woodcock Mark Friedl Adrien Finzi

Financial Support Core Partners

Lucy Hutyra