
SLIDE 1
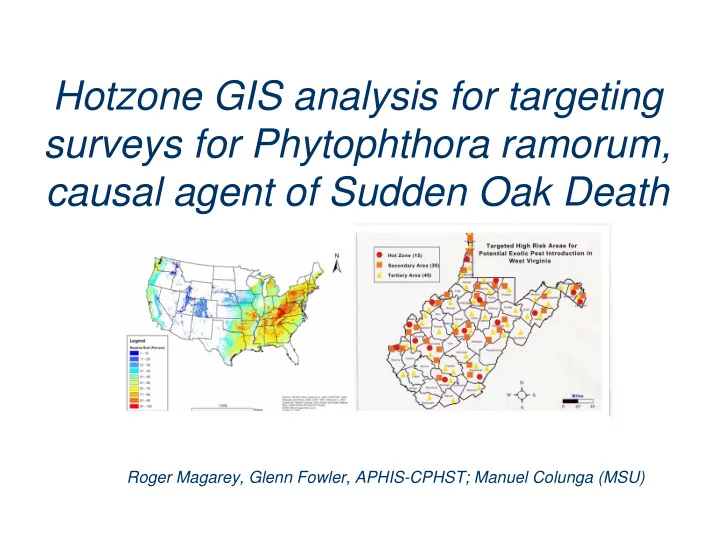
Hotzone GIS analysis for targeting surveys for Phytophthora ramorum, causal agent of Sudden Oak Death
Roger Magarey, Glenn Fowler, APHIS-CPHST; Manuel Colunga (MSU)
Hotzone GIS analysis for targeting surveys for Phytophthora ramorum, - - PowerPoint PPT Presentation
Hotzone GIS analysis for targeting surveys for Phytophthora ramorum, causal agent of Sudden Oak Death Roger Magarey, Glenn Fowler, APHIS-CPHST; Manuel Colunga (MSU) Hotzone GIS Analysis What is GIS Hotzone analysis Examples Crude
Roger Magarey, Glenn Fowler, APHIS-CPHST; Manuel Colunga (MSU)
Source J. Messineo APHIS.
Source Frank Sapio et al. USFS
Source Marla Downing, USFS
Shipments are based on 5 nurseries
Shipments are based on 5 nurseries
Sudden Oak Death Infection > 60 days
Wetness > 12 h
Shrub data was not used in this analyses
APHIS Hotzone Architecture
JMR 6/1/05
Decision Perspective
Analytical Tools
NAPIS Data
Traps Personnel Other Materials Habitat Model
Tables, Maps Graphs
Resource Allocation Box
PPQ 309, 429,523 Sales Genie Foreign Trade Data ATS SQL Data Analytical Tools Modeling Tools
Hotzone NAPPFAST
Tables, Maps Graphs
National Screen
PDA PDA PDA
Regional Screen State Screen National Program Managers Regional Program Managers Pest Survey Specialists State Plant Health Directors Plant Regulatory Officers
Commodity Flow Survey Other Other
Data Sourcing Data Management Analysis Decision Making
Commodity volume and distribution within the United States Data on shipments: domestic destination or port of exit, commodity, value, weight, mode(s) of transportation, the date on which the shipment Commodity flow survey (electronic) CFS Locations of Distributors within United States. Address of importers and distributors. Commercial sales databases Sales Genie Commerce Pinpointing trap locations with current
data Restricted to users with security clearance. Queries or reports could be dumped into system
commodity, importer address, shipment numbers. AUTOMATED TARGETING SYSTEM (ATS) ATS Customs i) Identify pest pathways 1) Violation/pest found (i.e. snail, bark beetle, bark contamination), 2) Shipper name and country of
Emergency action notification (Lotus notes) 523 i) Identify pest pathways Identifies pathways requiring treatment Fumigation database (Electronic) 429 i) Identifies pest association with imported commodity. ii) Pest interception volume and distribution Taxonomic ID of pest, commodity port. APHIS PPQ stores its reportable pests from all pathways (rail, air, sea, land, and inspection stations). It is used to determine what pests are found on what commodities, seasonality and frequency of pests. Pest interceptions (electronic) 309A PPQ Application Information Description Database
2) Identify, document and prioritize databases for use within the pest detection inf national, regional and state scales.
Top Hits National Regional Picks Hot Zone Local Host Location Habitat Pathways Hot Zones
Allocated Resources Survey $ 426,000 Type 1 66,500 Type 2 43,400 Type 3 23,000 Diag $ 567,000 Type 1 142,000 Type 2 59,000 Person $ 900,000 Group 1 750,000 Group 2 35,000 Equip $ 375,000 Type 1 225,000 Type 2 57,900 National
Decision Products
Top Hits National Regional Picks Hot Zone Local Host Location Habitat Pathways Hot Zones
Allocated Resources Survey $ 426,000 Type 1 66,500 Type 2 43,400 Type 3 23,000 Diag $ 567,000 Type 1 142,000 Type 2 59,000 Person $ 900,000 Group 1 750,000 Group 2 35,000 Equip $ 375,000 Type 1 225,000 Type 2 57,900 National