
SLIDE 1
Homework ¡2 ¡ ¡
- 1. ¡[10pt] ¡Assume ¡you ¡purchased ¡two ¡mice ¡of ¡the ¡same ¡strain, ¡one ¡male ¡and ¡one ¡
female ¡and ¡you ¡mated ¡the ¡two ¡to ¡produce ¡offspring ¡mice. ¡Then, ¡again ¡you ¡mated ¡the ¡
- ffspring ¡mice ¡to ¡produce ¡more ¡mice. ¡Assume ¡you ¡repeat ¡this ¡process ¡1,000 ¡
- generations. ¡Further ¡assume ¡your ¡friend ¡in ¡Australia ¡also ¡performed ¡the ¡same ¡
process ¡independently ¡with ¡the ¡same ¡strain ¡of ¡mice. ¡At ¡the ¡end ¡of ¡1,000 ¡generations ¡
- f ¡mating ¡mice, ¡how ¡would ¡you ¡describe ¡the ¡difference/similarity ¡between ¡the ¡
genomes ¡of ¡your ¡mice ¡and ¡your ¡friend’s ¡mice? ¡ ¡
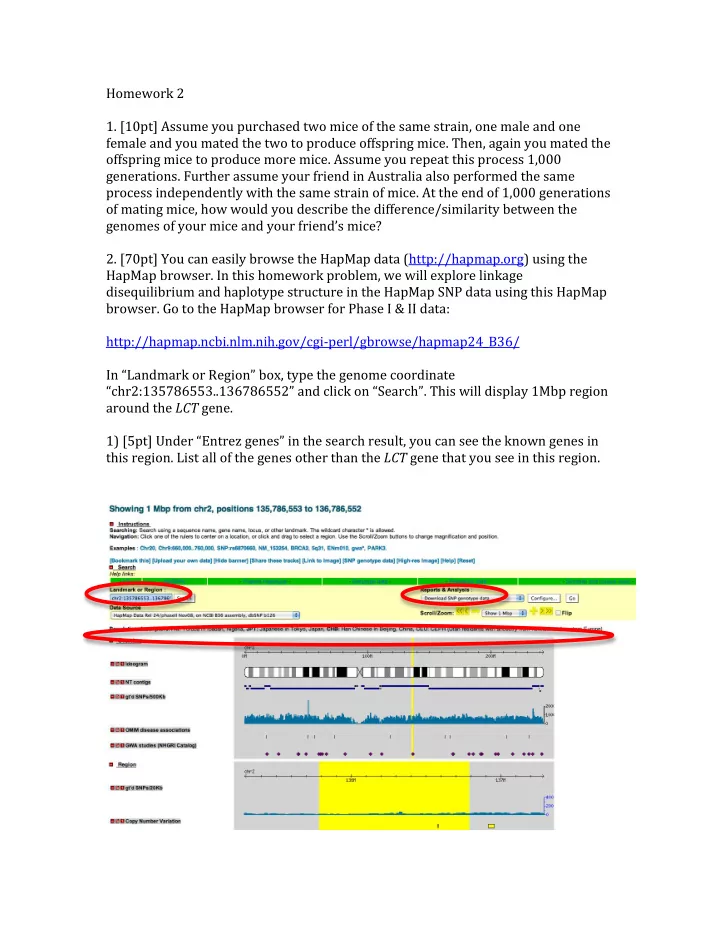
- 2. ¡[70pt] ¡You ¡can ¡easily ¡browse ¡the ¡HapMap ¡data ¡(http://hapmap.org) ¡using ¡the ¡
HapMap ¡browser. ¡In ¡this ¡homework ¡problem, ¡we ¡will ¡explore ¡linkage ¡ disequilibrium ¡and ¡haplotype ¡structure ¡in ¡the ¡HapMap ¡SNP ¡data ¡using ¡this ¡HapMap ¡
- browser. ¡Go ¡to ¡the ¡HapMap ¡browser ¡for ¡Phase ¡I ¡& ¡II ¡data: ¡