
SLIDE 1
History of S and R
(with some thoughts for the future)
John M. Chambers June 15, 2006
Statistical Software Today
- More software is available then ever before
for data analysis, & much of it is good.
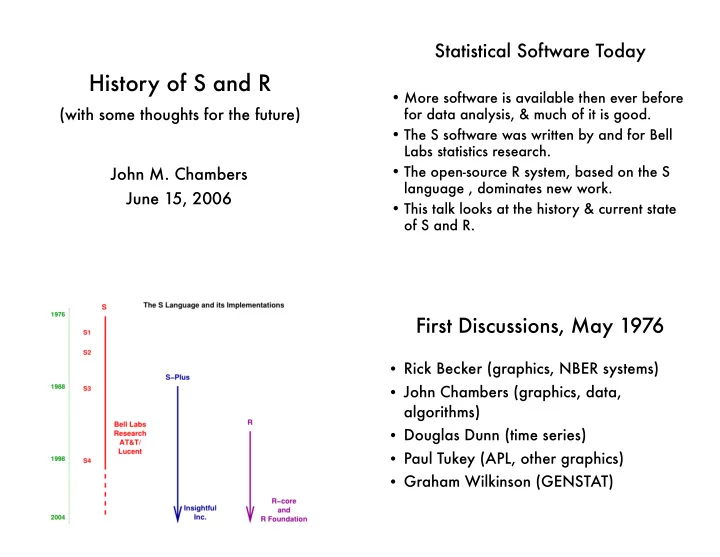
- The S software was written by and for Bell
Labs statistics research.
- The open-source R system, based on the S
language , dominates new work.
- This talk looks at the history & current state
- f S and R.
First Discussions, May 1976
- Rick Becker (graphics, NBER systems)
- John Chambers (graphics, data,
algorithms)
- Douglas Dunn (time series)
- Paul Tukey (APL, other graphics)
- Graham Wilkinson (GENSTAT)