/ ~ @£) HINDUSTAN FOODS LIMITED A Vanity Case Group Company Registered Office: Office No.3, Level-2, Centrium, Phoenix Market Ci ty, 15, Lal Bahadur Shastri Road, Kurla (West ), Mumbai, Maharashtra, India. 400 070. Emai l: business@thevanitycase.com Website: www.hindustanfoodslimited.com Tel. No. +91-22-61801700 I 01 CIN: L 15139MH1984PLC316003 Company Scrip Code: 519126 Date: 2?ili February, 2020 To, The General Manager Department of Corporate Services Through Listing Centre BSE Limited Floor 25, P. J. Towers, Dalal Street, Mumbai-400 001. Tel : (022) 2272 1233 I 34 Dear Sir I Madam, Sub.: Earnings Presentation for 03 FY 2019-20 In pursuance to Regulation 30 of the SEBI (Listing Obligations and Disclosure Requirements) Regulations, 2015, please find enclosed herewith the Earnings Presentation for Q3 ended 3P 1 December, 2019 ofFY 2019-20. We request you to take the above on record. Thanking you, Yours faithfully for HINDUSTAN FOODS LIMITED aA ~v Bankim Purohit Company Secretary ACS: 21865 Encl.: As above VANITY CASE Inte gr ity Initi at ive Innovation
HINDUSTAN FOODS LIMITED EARNINGS PRESENTATION | Q3-FY19-20
Q3-FY20 Consolidated Performance Highlights OPERATIONAL INCOME [INR MN] EBITDA [INR MN] • Operational Revenue for Q3-FY20 grew by 68% YoY. • EBITDA grew by more than 50%. 152 2071 130 1725 101 1224 • PAT for the quarter grew by 68% YoY. Q3-FY19 Q2-FY20 Q3-FY20 Q3-FY19 Q2-FY20 Q3-FY20 • The process of demerger of the Hyderabad facility of Avalon Cosmetics Private Limited with the company has been successfully accomplished. PAT [INR MN] BASIC EPS [INR] • ATC Beverages Private Limited, an associate of the company, has successfully ramped up production and is expected to reach its optimal capacity utilization in Q4FY20. 3.52 65 2.82 52 2.31 42 • The Company has effectively enhanced production at its green-field project in Coimbatore for packing of tea, coffee and other beverages. Q3-FY19 Q2-FY20 Q3-FY20 Q3-FY19 Q2-FY20 Q3-FY20 *The above financials reflect merger of the Hyderabad unit, and the comparatives have been restated for current and previous financial year. 2
Consolidated Quarterly Income Statements (Ind-As) Y-o-Y Q-o-Q Income Statement (INR Mn) Q3-FY20 Q3-FY19 Q2-FY20 % Change % Change Operational Income 2,071.36 1,224.24 69.20% 1,724.98 20.08% Total Expenses 1,972.68 1,164.08 69.46% 16,457.48 19.87% EBITDA 151.72 100.91 50% 130.60 16.17% Depreciation 26.46 17.72 49.34% 25.03 5.72% Interest 23.78 18.03 31.90% 24.72 -3.79% Other Income 2.80 5.00 -43.98% 1.63 72% Share of profit/loss from associate (5.50) - NA (1.66) 230.81% PBT 95.98 65.16 47.31% 79.19 21.20% Tax 36.59 22.65 61.59% 29.00 26.21% Profit After tax 59.38 42.51 39.69% 50.20 18.30% PAT Margins(%) 2.87% 3.47% 2.91% -1.48% Other Comprehensive Income - - NA - NA Total Comprehensive Income 59.38 42.51 39.69% 49.93 18.93% Basic EPS (INR) 3.22 2.31 39.69% 2.73 18.30% 3
Nine Months-FY20 Consolidated Performance Highlights OPERATIONAL INCOME (INR MN) EBITDA (INR MN) 5235 392 270 3415 NM-FY19 NM-FY20 NM-FY19 NM-FY20 PAT (INR MN) BASIC EPS (INR) 8.107 149 6.02 110 NM-FY19 NM-FY20 NM-FY19 NM-FY20 4
Consolidated Nine Months Income Statement Income Statement (INR Mn) 9m-FY20 9m-FY19 Y-o-Y % change 5,235.26 3,414.67 53.32% Operational Income 4,996.37 3,252.84 53.60% Total Expenses 391.83 269.78 45.24% EBITDA 74.70 51.79 44.24% Depreciation 72.92 49.90 46.13% Interest 5.33 6.26 -14.94% Other Income (7.16) - NA Share of profit/loss from associate 237.05 168.09 41.03% PBT 149.27 109.67 36.11% Tax 148.45 109.50 35.56% Profit After tax 2.84% 3.21% -11.58% PAT Margins(%) - - NA Other Comprehensive Income 148.4 109.5 35.56% Total Comprehensive Income 8.1 6.0 34.53% Basic EPS (INR) 5
Q3-FY20 Consolidated Financial Performance YoY Financial Performance [Q3-FY20 vs Q3-FY19] • With addition of new product categories and increase in existing capacities and merger of the Hyderabad unit, the Company has posted its highest ever turnover and profits. • Depreciation increased primarily due to the capitalization of the Coimbatore tea plant. • Increase in interest cost was due to term loan taken for Coimbatore plant and also increase in working capital facilities • The share of profit/loss from associate of INR 5.50 Mn is related to the associate company ATC Beverages Ltd in which the company holds 45.40% • Tax expense is increased due to deferred tax due to increased depreciation because of rapid expansion. Sequential Financial Performance (Q3-FY20 vs. Q2-FY20) • Besides the Hyderabad merger, increase in revenue was also due to the ramp up of tea and coffee production in the Coimbatore plant. • EBITDA increase was due to ramping up of the new factory and resultant operational efficiencies. Capitalization and Borrowings • Long term borrowings have increased to finance the expansion. Future CAPEX Plans • The company is proposing to set up a liquid manufacturing facility in Silvassa for a leading home care liquid brand. The board has authorized an investment of up to INR 30 Cr in this facility which includes buying out the existing factory of the promoter group and additional investments. The factories will have a capacity to manufacture around 20,000 Kl of liquids and the company hopes to enter into a multi-year contract for the same. 6
Promoter Group Consolidation Hyderabad Facility: • The legal process for the merger of the Hyderabad Unit (HUL Detergent factory) has been accomplished. • Financials have been consolidated in HFL books. • Since it is a common control transaction, the financials of last year is also restated since the appointed date was 1 st April 2018. • The new facility for HUL manufacturing Liquid Detergent and Shampoo started trial production towards the end of Q3FY20. The next quarter will see commercialization and ramp-up of production . 7
ABOUT HFL 8
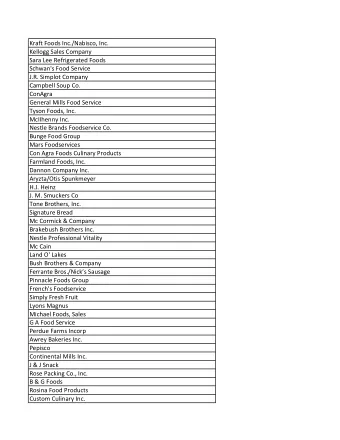
Company Overview Key Clients Introduction • Hindustan Foods Ltd. was founded in 1984, promoted by the Dempo Group. • The company offers Dedicated and Shared Manufacturing services to top FMCG corporates who are looking to minimize cost while maximizing product quality in the post-GST environment. • In 2013, Vanity Case Group bought a controlling stake in Hindustan Foods Ltd. and since then the company has diversified across various FMCG categories with manufacturing competencies in Food & Beverages, Home Care, Personal Care, Fabric Care, Leather products and Pest Control. • The Vanity Case Group was founded in the year 2001 and is one of the largest and most diversified FMCG contract manufacturers in India, under the visionary leadership of Mr. Sameer Kothari. • Over the years, HFL has transformed into a scalable, profitable, and the most diversified contract manufacturer catering to various marquee customers. • The company has a vision of growing 20x by 2020 to reach a turnover of INR 1,000 Crores, through various organic and inorganic strategies. • HFL has a market capitalization of INR 9281.6 Mn as on 31 st December, 2019. 9
Manufacturing Facilities Goa Pondicherry Mumbai • Key Clients: Espirit, Saks Fifth • Key Clients : • Key Clients: Danone, Pepsico, Avenue, Dune, Myntra, Lollipop, International: TBS, Jomos, Gabor Marico Flipkart. Indian : Bata, Hush • Products: Baby Food Products & • Products: Primarily Shoes for Snacks Puppies, US Polo, Women & Men • Brands : Farex, First Food, Easum, Arrow Kurkure Puff-corn. • Products : Shoes for Men, Women and Juniors & Uppers 10
Manufacturing Facilities Jammu Coimbatore Hyderabad • Key Client : Hindustan Unilever • Key Client: Reckitt Benckiser • Key Client : Hindustan Unilever • Products : Tea, Coffee • Products : Detergent Powder, Liquid • Products : Coils, Vaporizers, Aerosols • Brands : Tea: Taj Mahal, Lipton, 3 Detergent, Shampoo • Brands : Mortein Roses • Brands : Surf, Surf Excel, Rin, Wheel, Coffee: Bru Comfort, etc 11
HISTORICAL FINANCIALS 12
Consolidated Historical Income Statement (Ind-As)-* Income Statement (INR Mn) FY17 FY18 FY19* 9M-FY20* 5,235 Operational Income 387 1,389 4,891.58 4,996 Total Expenses 357 1,288 4,716.53 392 EBITDA 30 101 329.36 75 Depreciation 14 12 74.29 73 Interest 10 13 73.53 5 Other Income 2 11 6.49 -7 Share of profit/loss from associate - - - 237 PBT 8 87 181.54 149 Tax 2 24 63.10 148 Profit After tax 7 63 118.44 2.84% PAT Margins(%) 1.81% 4.54% 2.42% 0 Other Comprehensive Income -2 - - 148.45 Total Comprehensive Income 5 63 117.63 6.49 8.10 Basic EPS (INR) 0.65 4.81 * Post merger (FY19 and 9M FY20 is with merger effect) 13 13
Recommend
More recommend
Unleash a World of Digital Possibilities—Browse, Share, and Explore Content Without Boundaries