
SLIDE 1
12/22/2014 1
1
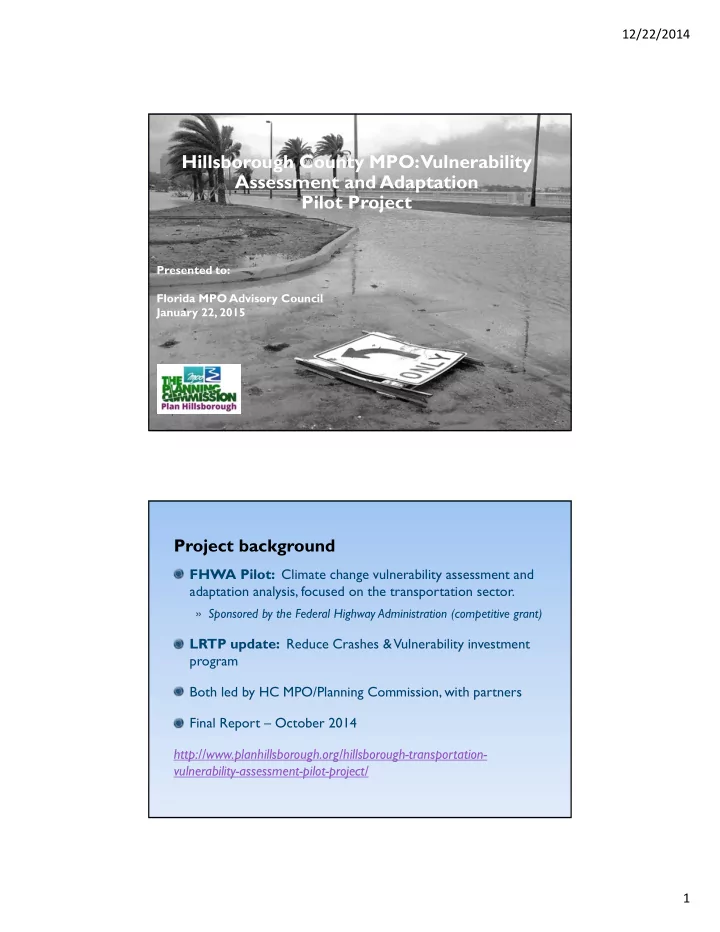
Hillsborough County MPO: Vulnerability Assessment and Adaptation Pilot Project
Presented to: Florida MPO Advisory Council January 22, 2015
Project background
FHWA Pilot: Climate change vulnerability assessment and adaptation analysis, focused on the transportation sector.
» Sponsored by the Federal Highway Administration (competitive grant)