
SLIDE 1
High Speed Turbulence Working Group
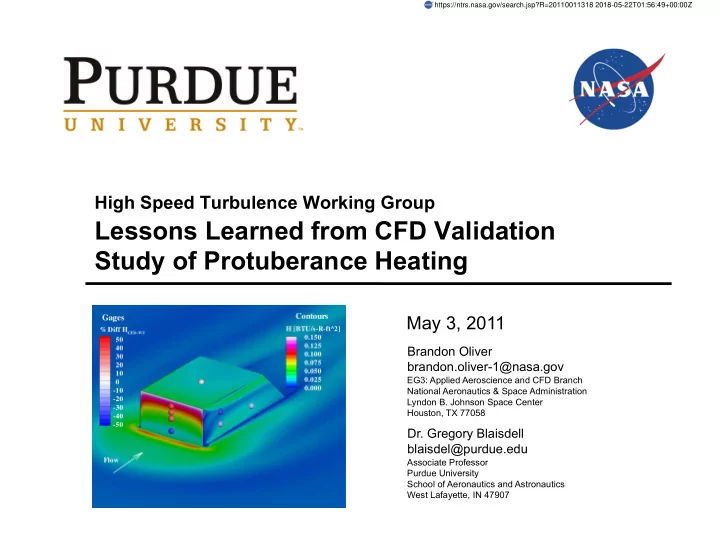
Lessons Learned from CFD Validation Study of Protuberance Heating
May 3, 2011
Brandon Oliver brandon.oliver-1@nasa.gov
EG3: Applied Aeroscience and CFD Branch National Aeronautics & Space Administration Lyndon B. Johnson Space Center Houston, TX 77058
- Dr. Gregory Blaisdell
blaisdel@purdue.edu
Associate Professor Purdue University School of Aeronautics and Astronautics West Lafayette, IN 47907
https://ntrs.nasa.gov/search.jsp?R=20110011318 2018-05-22T01:56:49+00:00Z