
SLIDE 1
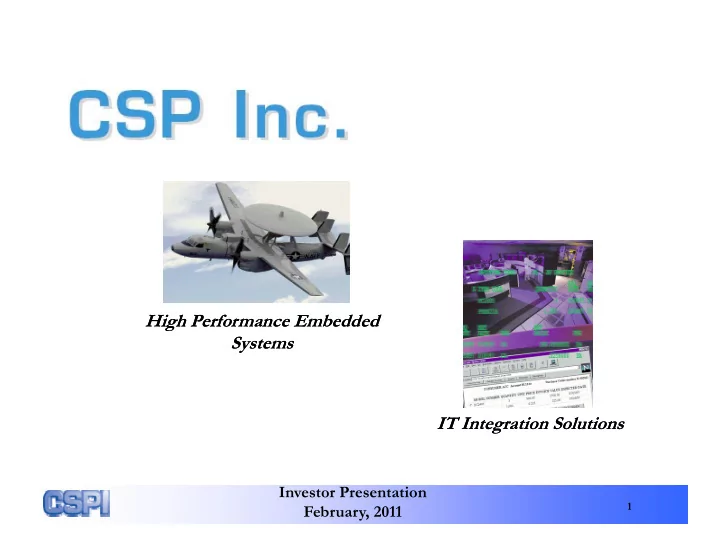
High Performance Embedded High Performance Embedded Systems Systems IT Integration Solutions IT Integration Solutions
1
High Performance Embedded High Performance Embedded Systems - - PowerPoint PPT Presentation
High Performance Embedded High Performance Embedded Systems Systems IT Integration Solutions IT Integration Solutions Investor Presentation 1 February, 2011 CSP Inc. The Company wishes to take advantage of the safe harbor provisions
1
2
– 2 Segments 2 Segments
– 139 People
3
4
95 0 76.8 83.4 95.0
60 80 100
$ Millions 22.1
20 40 60
Revenue - $ FY 2008 FY 2009 FY 2010 FY 2011 Q1
1.00 1.25
d $0.25 $0.11
0 00 0.25 0.50 0.75 00
hare - Diluted ($0.11)
(0.75) (0.50) (0.25) 0.00
1 2 3 4arnings per Sh
5
($1.05)
(1.25) (1.00)
Ea
6
7
Network Cloud Compute Cloud 8
Vulnerability Scanning Intrusion Detection Patch Management Firewall Monitoring
Penetration tion Exterior trusion Detect External Access Int Anti-Virus 9
10
“New” IT Spending
11 Source: IDC Directions 2007
Highlights Highlights – Excellent Customer references – 40 years experience – Technology leadership in open systems software model
Sonar Systems
12
– Air, Land and Sea Platforms – Extended Temperature, Humidity, Sand, Dust, Shock, Vibration and
– E2-D
– Radar
Corrosive Elements
– GASS – HYDRA – SAPPS – C4ISR/AJCN d – Sonar – C4ISR
Surveillance and Reconnaissance
– Raytheon
– Dense / High Performance Clusters g – Open – Linux / VxWorks – Commercial (VME), Rugged and Conduction Cooled Solutions
i i ti d d t t t ’ i 13
requirements
14
$27.0 $0.7 $2 3 $3.0
(Boards)
$2.3
(Systems)
15
Sources: Venture Development Corp. Embedded COTS in Military, Aerospace and Defense Study, 2008 COTS Journal October 2008
$70.0 $10.0
Revenue Stream
$50.0 $60.0 $7.0 $8.0 $9.0 Millions) Millions) $20.0 $30.0 $40.0 $3.0 $4.0 $5.0 $6.0 ative Revenue (in $ nual Revenue (in $ M
Pilot Production LRIP $3 - 10M EDM and SD&D $3.5M
$- $10.0 $- $1.0 $2.0 Y05 Y06 Y07 Y08 Y09 Y10 Y11 Y12 Y13 Y14 Y15 Y16 Y17 Y18 Y19 Y20 Cumula Ann
$3.5M
$4M $2M $1 5M
FY FY FY FY FY FY FY FY FY FY FY FY FY FY FY FY
Note: Revenue opportunity in 2012 and beyond is subject to DoD funding and schedule decisions
$4M $2M $1.5M
16
17
83.4 95.0
100
76.8
80
40 60
22.1
20
FY 2008 FY 2009 FY 2010 FY 2011 Q1
18
1 25 0.75 1.00 1.25
$0.25 $0.11
0.25 0.50 0.75
($0.11) $0.11
(0.25) 0.00
(0.75) (0.50)
($1.05)
(1.25) (1.00)
FY 2008 FY 2009 FY 2010 FY 2011 Q1
19
3.00 3.50 4.00 4.50
0.91 0.39
0 50 1.00 1.50 2.00 2.50
(0.41) 0.39
(1 50) (1.00) (0.50) 0.00 0.50
(3 80)
(3 50) (3.00) (2.50) (2.00) (1.50)
(3.80)
(4.00) (3.50)
FY 2008 FY 2009 FY 2010 FY 2011 Q1
20
21
Service and Systems Integration
(GM @ 13%)
Blended GM of 18 %
Systems
(GM @ 67%)
22
Dollars in Millions 9/30/2009 9/30/2010 12/31/2010 Dollars in Millions 9/30/2009 9/30/2010 12/31/2010 Assets Cash & Short Term Investments 18 9 $ 15 5 $ 16 0 $ Cash & Short Term Investments 18.9 $ 15.5 $ 16.0 $ Accounts Receivable 7.4 $ 12.2 $ 11.5 $ Inventory 5.9 $ 5.9 $ 6.2 $ Other current assets 3.7 $ 2.4 $ 2.4 $ C A 35 9 $ 36 0 $ 36 1 $ Current Assets 35.9 $ 36.0 $ 36.1 $ Long-term assets 4.6 $ 5.4 $ 5.4 $ Total Assets 40.5 $ 41.4 $ 41.5 $ Liabilities & Shareholders' Equity Current Liabilities 13.2 $ 13.9 $ 13.9 $ Pensions & Other Long Term Liabilities 8.6 $ 9.0 $ 8.9 $ Shareholders' equity 18.7 $ 18.5 $ 18.7 $ Total Liabilities & Shareholders' Equity 40.5 $ 41.4 $ 41.5 $
23
Working Capital 22.7 $ 22.1 $ 22.2 $
like network security management and unified like network security management and unified communications
partnerships to leverage success in infrastructure solutions
leverage NOC to expand managed services
OpenVPX 3000 SERIES product lines.
24
25