
SLIDE 1
High-Energy Gamma- Rays from the Milky Way: 3D Spatial Models for - - PowerPoint PPT Presentation
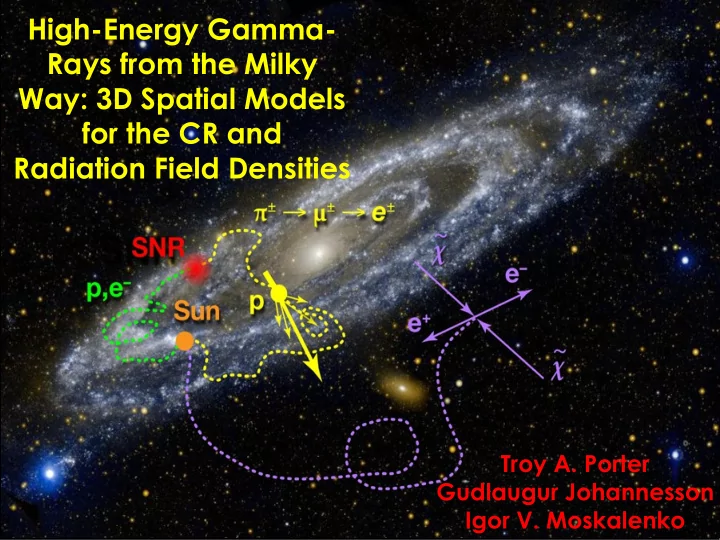
High-Energy Gamma- Rays from the Milky Way: 3D Spatial Models for the CR and Radiation Field Densities Troy A. Porter Gudlaugur Johannesson Igor V. Moskalenko 3D models for the Interstellar Emission N e w r e l e a s e o f G A L P R O P ( v
Troy A. Porter, Stanford University ICRC 2017, Busan
Troy A. Porter, Stanford University ICRC 2017, Busan
Troy A. Porter, Stanford University ICRC 2017, Busan
Troy A. Porter, Stanford University ICRC 2017, Busan
Troy A. Porter, Stanford University ICRC 2017, Busan
Troy A. Porter, Stanford University ICRC 2017, Busan
Troy A. Porter, Stanford University ICRC 2017, Busan
Troy A. Porter, Stanford University ICRC 2017, Busan
Troy A. Porter, Stanford University ICRC 2017, Busan
Troy A. Porter, Stanford University ICRC 2017, Busan
Troy A. Porter, Stanford University ICRC 2017, Busan
Troy A. Porter, Stanford University ICRC 2017, Busan