
SLIDE 1
1
April 18, 2018
CPAs & ADVISORS
- M. Aaron Little, CPA
Managing Director mlittle@bkd.com
HHFMA Call With the Experts – April 18, 2018
HHGM Insights:
60 vs. 30-Day Payment Periods
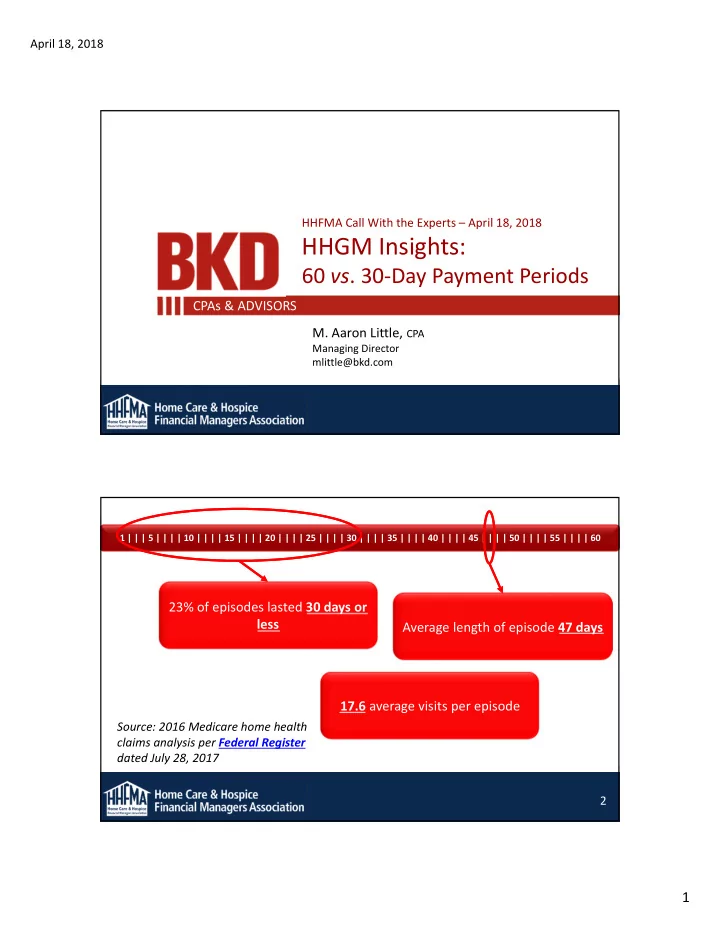
2 Source: 2016 Medicare home health claims analysis per Federal Register dated July 28, 2017
1 | | | 5 | | | | 10 | | | | 15 | | | | 20 | | | | 25 | | | | 30 | | | | 35 | | | | 40 | | | | 45 | | | | 50 | | | | 55 | | | | 60